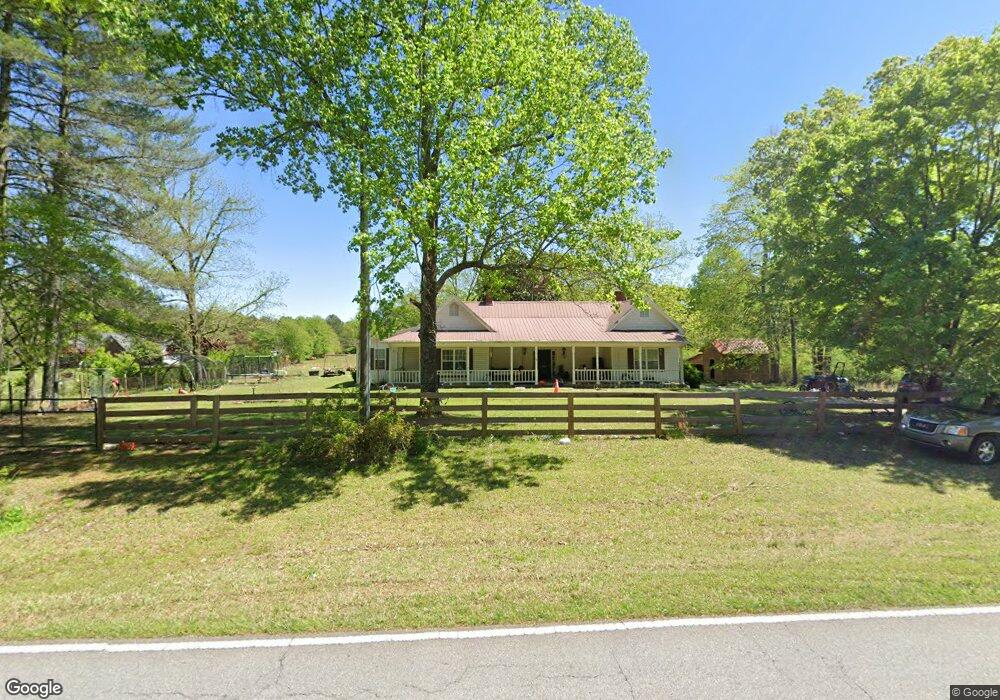
4361 S Hickory Level Rd Carrollton, GA 30116
Abilene NeighborhoodEstimated Value: $430,303 - $512,000
4
Beds
3
Baths
2,538
Sq Ft
$187/Sq Ft
Est. Value
About This Home
This home is located at 4361 S Hickory Level Rd, Carrollton, GA 30116 and is currently estimated at $475,576, approximately $187 per square foot. 4361 S Hickory Level Rd is a home located in Carroll County with nearby schools including Ithica Elementary School, Bay Springs Middle School, and Villa Rica High School.
Ownership History
Date
Name
Owned For
Owner Type
Purchase Details
Closed on
Oct 20, 2017
Sold by
Law Travis K
Bought by
Wells Joseph A and Wells Lauren A
Current Estimated Value
Home Financials for this Owner
Home Financials are based on the most recent Mortgage that was taken out on this home.
Original Mortgage
$287,400
Outstanding Balance
$240,124
Interest Rate
3.83%
Mortgage Type
VA
Estimated Equity
$235,452
Purchase Details
Closed on
Dec 18, 2002
Sold by
Tiger Relocation Company
Bought by
Law Travis K and Law Kelley S
Purchase Details
Closed on
Sep 3, 2002
Sold by
Wiggins Terri
Bought by
Tiger Relocation Company
Purchase Details
Closed on
Nov 6, 1998
Sold by
Chastain Gary
Bought by
Wiggins Terri
Purchase Details
Closed on
Dec 30, 1994
Sold by
Humphries Sam
Bought by
Chastain Gary
Purchase Details
Closed on
May 23, 1991
Bought by
Humphries Sam
Create a Home Valuation Report for This Property
The Home Valuation Report is an in-depth analysis detailing your home's value as well as a comparison with similar homes in the area
Home Values in the Area
Average Home Value in this Area
Purchase History
| Date | Buyer | Sale Price | Title Company |
|---|---|---|---|
| Wells Joseph A | $287,400 | -- | |
| Law Travis K | $76,000 | -- | |
| Tiger Relocation Company | $110,000 | -- | |
| Wiggins Terri | $125,000 | -- | |
| Chastain Gary | $50,000 | -- | |
| Humphries Sam | $37,900 | -- |
Source: Public Records
Mortgage History
| Date | Status | Borrower | Loan Amount |
|---|---|---|---|
| Open | Wells Joseph A | $287,400 |
Source: Public Records
Tax History Compared to Growth
Tax History
| Year | Tax Paid | Tax Assessment Tax Assessment Total Assessment is a certain percentage of the fair market value that is determined by local assessors to be the total taxable value of land and additions on the property. | Land | Improvement |
|---|---|---|---|---|
| 2024 | $2,441 | $130,626 | $26,005 | $104,621 |
| 2023 | $2,441 | $116,251 | $20,804 | $95,447 |
| 2022 | $1,968 | $90,424 | $13,870 | $76,554 |
| 2021 | $1,774 | $77,090 | $11,096 | $65,994 |
| 2020 | $1,618 | $68,303 | $10,087 | $58,216 |
| 2019 | $1,555 | $64,086 | $10,087 | $53,999 |
| 2018 | $1,534 | $58,434 | $9,427 | $49,007 |
| 2017 | $1,434 | $58,434 | $9,427 | $49,007 |
| 2016 | $1,434 | $58,434 | $9,427 | $49,007 |
| 2015 | $1,728 | $65,787 | $12,974 | $52,813 |
| 2014 | $1,735 | $65,787 | $12,974 | $52,813 |
Source: Public Records
Map
Nearby Homes
- 577 W Hickory Level Rd
- 415 Paynes Lake Rd
- 0 Paynes Lake Rd Unit 7339831
- 0 Paynes Lake Rd Unit 10254856
- 56 Dahlia Ct
- 2020 Carrollton Hwy
- 59 Tulip Way
- 0 Roy Morgan Rd Unit 17.44 ACRES
- 160 & 168 Roy Morgan Rd
- 0 Roy Morgan Rd Unit 7671946
- 301 Spruill Bridge Rd
- 472 Price Rd
- 352 Price Rd
- 252 Spruill Bridge Rd
- 382 Price Rd
- 160 Old Sandhill Rd
- 3279 Shady Grove Rd
- 1620 Bar J Rd
- 0
- 183 Muse Bridge Rd
- 4361 S Hickory Level Rd
- 4361 S Hickory Level Rd
- S S Hickory Level Rd Unit 5
- S S Hickory Level Rd
- 4401 S Hickory Level Rd Unit 5
- 4401 S Hickory Level Rd
- 4317 S Hickory Level Rd
- 4410 S Hickory Level Rd
- 44 Humphries Dr
- 110 Humphries Dr
- 101 Humphries Dr
- 4314 S Hickory Level Rd
- 0 Humphries Dr
- 0 Humphries Dr Unit 7294138
- 4448 S Hickory Level Rd
- 4461 S Hickory Level Rd
- 107 Humphries Dr
- 115 Humphries Dr
- 4300 S Hickory Level Rd
- 4137 Shady Grove Rd