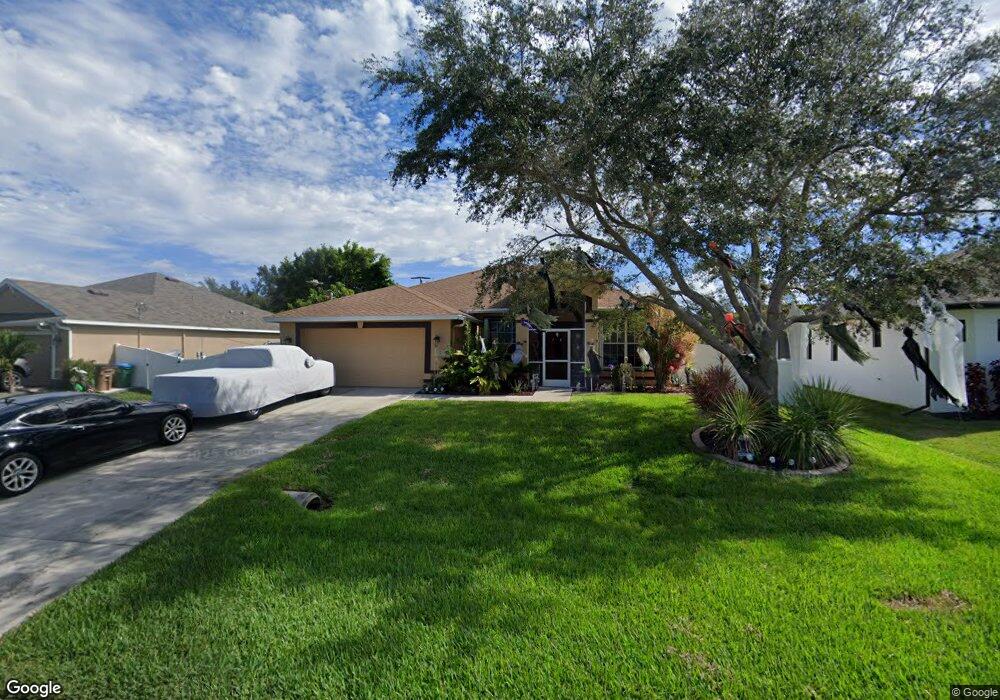
4361 SW 20th Place Cape Coral, FL 33914
Pelican NeighborhoodEstimated Value: $362,810 - $563,000
4
Beds
2
Baths
2,479
Sq Ft
$183/Sq Ft
Est. Value
About This Home
This home is located at 4361 SW 20th Place, Cape Coral, FL 33914 and is currently estimated at $453,703, approximately $183 per square foot. 4361 SW 20th Place is a home located in Lee County with nearby schools including Cape Elementary School, Caloosa Elementary School, and Tropic Isles Elementary School.
Ownership History
Date
Name
Owned For
Owner Type
Purchase Details
Closed on
Dec 28, 2004
Sold by
Gold Coast Homes Of Sw Florida Inc
Bought by
Rasch Joseph F
Current Estimated Value
Home Financials for this Owner
Home Financials are based on the most recent Mortgage that was taken out on this home.
Original Mortgage
$209,483
Outstanding Balance
$104,770
Interest Rate
5.71%
Mortgage Type
Unknown
Estimated Equity
$348,933
Purchase Details
Closed on
Feb 26, 2004
Sold by
Casman Mark Allen
Bought by
Gold Coast Homes Sw Fl Inc
Purchase Details
Closed on
Mar 28, 2003
Sold by
Cosman David M
Bought by
Casman Mark Allen
Purchase Details
Closed on
Jun 18, 2002
Sold by
Long Julian and Long Gerri
Bought by
Casman David M
Purchase Details
Closed on
May 7, 2002
Sold by
Schwarz Peter
Bought by
Long Julian and Long Gerri
Purchase Details
Closed on
May 26, 2000
Sold by
Funk Horst
Bought by
Schwarz Peter
Purchase Details
Closed on
Jun 23, 1998
Sold by
Patten Debra L
Bought by
Funk Horst
Create a Home Valuation Report for This Property
The Home Valuation Report is an in-depth analysis detailing your home's value as well as a comparison with similar homes in the area
Home Values in the Area
Average Home Value in this Area
Purchase History
| Date | Buyer | Sale Price | Title Company |
|---|---|---|---|
| Rasch Joseph F | $261,900 | Team Title Insurance Inc | |
| Gold Coast Homes Sw Fl Inc | $8,000 | -- | |
| Casman Mark Allen | -- | -- | |
| Casman David M | $8,000 | -- | |
| Long Julian | $8,000 | -- | |
| Schwarz Peter | $4,500 | -- | |
| Funk Horst | $4,500 | -- |
Source: Public Records
Mortgage History
| Date | Status | Borrower | Loan Amount |
|---|---|---|---|
| Open | Rasch Joseph F | $209,483 |
Source: Public Records
Tax History Compared to Growth
Tax History
| Year | Tax Paid | Tax Assessment Tax Assessment Total Assessment is a certain percentage of the fair market value that is determined by local assessors to be the total taxable value of land and additions on the property. | Land | Improvement |
|---|---|---|---|---|
| 2025 | $2,668 | $157,374 | -- | -- |
| 2024 | $2,538 | $152,939 | -- | -- |
| 2023 | $2,538 | $148,484 | $0 | $0 |
| 2022 | $2,321 | $144,159 | $0 | $0 |
| 2021 | $2,319 | $233,534 | $50,328 | $183,206 |
| 2020 | $2,328 | $138,028 | $0 | $0 |
| 2019 | $2,253 | $134,925 | $0 | $0 |
| 2018 | $2,234 | $132,409 | $0 | $0 |
| 2017 | $2,080 | $122,645 | $0 | $0 |
| 2016 | $2,015 | $179,230 | $31,729 | $147,501 |
| 2015 | $2,009 | $150,900 | $31,192 | $119,708 |
| 2014 | -- | $147,215 | $21,082 | $126,133 |
| 2013 | -- | $133,100 | $12,424 | $120,676 |
Source: Public Records
Map
Nearby Homes
- 2008 SW 44th Terrace
- 2000 SW 44th Terrace
- 2025 SW 45th Terrace
- 4418 SW 19th Place
- 4343 SW 20th Ave
- 4345 Agualinda Blvd
- 2608 SW 20th Ave
- 4509 Agualinda Blvd
- 4328 SW 20th Place
- 4715 Agualinda Blvd
- 4833 SW 25th Place
- 4337 & 4339 SW 9th Ave
- 914 SW 33rd Terrace
- 4844 SW 24th Ave
- 3036 SW 22nd Place
- 2417 SW 11th Place
- 2421 SW 11th Place
- 3107 SW 19th Ave
- 3909 SW 20th Ave
- 2907 SW 25th Place
- 4357 SW 20th Place
- 4360 SW 20th Ave
- 4408 SW 20th Ave
- 4355 SW 20th Ave
- 4353/4355 SW 20th Place
- 4413 SW 20th Place
- 4409 SW 20th Place
- 4354 SW 20th Ave
- 4360 SW 20th Place
- 4408 SW 20th Place
- 4356 SW 20th Place
- 4352 SW 20th Ave
- 4412 SW 20th Place
- 4352 SW 20th Place
- 4417 SW 20th Place
- 4417 SW 20th Place
- 4416 SW 20th Ave
- 4416 SW 20th Place
- 4348 SW 20th Place
- 4359 SW 20th Ave