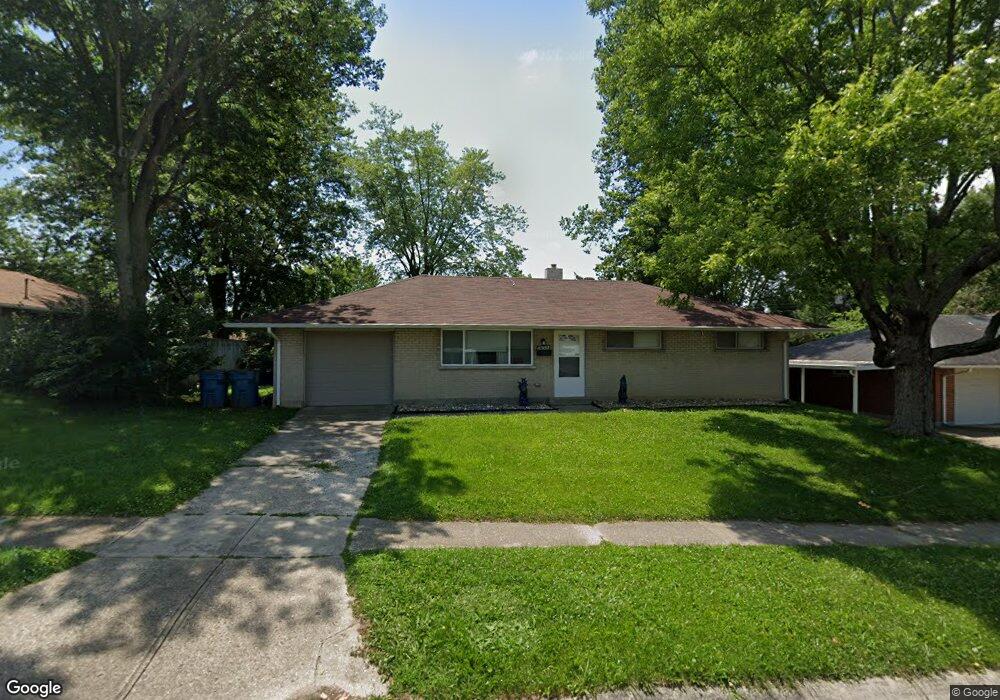
4362 Kitridge Rd Dayton, OH 45424
Estimated Value: $170,422 - $185,000
3
Beds
2
Baths
1,080
Sq Ft
$162/Sq Ft
Est. Value
About This Home
This home is located at 4362 Kitridge Rd, Dayton, OH 45424 and is currently estimated at $175,356, approximately $162 per square foot. 4362 Kitridge Rd is a home located in Montgomery County with nearby schools including Wayne High School and Pathway School of Discovery.
Ownership History
Date
Name
Owned For
Owner Type
Purchase Details
Closed on
Mar 28, 2019
Sold by
Bokland Llc
Bought by
Buss Richard R
Current Estimated Value
Home Financials for this Owner
Home Financials are based on the most recent Mortgage that was taken out on this home.
Original Mortgage
$73,260
Outstanding Balance
$64,409
Interest Rate
4.3%
Mortgage Type
FHA
Estimated Equity
$110,947
Purchase Details
Closed on
Mar 1, 2019
Sold by
Ober Gary A and Ober Bokhee
Bought by
Bokland Llc
Home Financials for this Owner
Home Financials are based on the most recent Mortgage that was taken out on this home.
Original Mortgage
$73,260
Outstanding Balance
$64,409
Interest Rate
4.3%
Mortgage Type
FHA
Estimated Equity
$110,947
Purchase Details
Closed on
Dec 12, 2011
Sold by
Stedge John P and Ober Gary A
Bought by
Bokland Llc
Purchase Details
Closed on
Feb 20, 2007
Sold by
Estate Of Ralph D Trochelman
Bought by
Trochelman Patricia A
Create a Home Valuation Report for This Property
The Home Valuation Report is an in-depth analysis detailing your home's value as well as a comparison with similar homes in the area
Home Values in the Area
Average Home Value in this Area
Purchase History
| Date | Buyer | Sale Price | Title Company |
|---|---|---|---|
| Buss Richard R | $77,800 | Fidelity Lawyers Ttl Agcy Ll | |
| Bokland Llc | -- | Fidelity Lawyers Ttl Agcy Ll | |
| Bokland Llc | -- | Attorney | |
| Trochelman Patricia A | -- | None Available |
Source: Public Records
Mortgage History
| Date | Status | Borrower | Loan Amount |
|---|---|---|---|
| Open | Buss Richard R | $73,260 |
Source: Public Records
Tax History Compared to Growth
Tax History
| Year | Tax Paid | Tax Assessment Tax Assessment Total Assessment is a certain percentage of the fair market value that is determined by local assessors to be the total taxable value of land and additions on the property. | Land | Improvement |
|---|---|---|---|---|
| 2024 | $2,054 | $38,670 | $10,010 | $28,660 |
| 2023 | $2,054 | $38,670 | $10,010 | $28,660 |
| 2022 | $1,819 | $27,020 | $7,000 | $20,020 |
| 2021 | $1,848 | $27,020 | $7,000 | $20,020 |
| 2020 | $1,850 | $27,020 | $7,000 | $20,020 |
| 2019 | $1,681 | $21,670 | $7,000 | $14,670 |
| 2018 | $1,687 | $21,670 | $7,000 | $14,670 |
| 2017 | $1,677 | $21,670 | $7,000 | $14,670 |
| 2016 | $1,598 | $20,110 | $7,000 | $13,110 |
| 2015 | $1,579 | $20,110 | $7,000 | $13,110 |
| 2014 | $1,579 | $20,110 | $7,000 | $13,110 |
| 2012 | -- | $15,760 | $8,750 | $7,010 |
Source: Public Records
Map
Nearby Homes
- 4309 Kitridge Rd
- 5059 Key West Dr
- 4420 Kitridge Rd
- 5041 Pepper Dr
- 5431 Naughton Dr
- 5365 Mariner Dr
- 5062 Nielson Ct
- 5455 Naughton Dr
- 5560 Harshmanville Rd
- 5433 Pentland Cir
- 4918 Powell Rd
- 4848 Rittenhouse Dr
- 4608 Nowak Ave
- 4407 Nowak Ave
- 4470 Mahler Dr
- 5669 Traymore Dr
- 5660 Tomberg St
- 4440 Longfellow Ave
- Juniper with Finished Basement Plan at Heathermere Woods
- 4061 Hemlock Ct
- 4356 Kitridge Rd
- 5189 Packard Dr
- 4681 Kautz Dr
- 4671 Kautz Dr
- 5145 Packard Dr
- 4350 Kitridge Rd
- 4361 Kitridge Rd
- 4661 Kautz Dr
- 4355 Kitridge Rd
- 5201 Packard Dr
- 5188 Packard Dr
- 4351 Kitridge Rd
- 4344 Kitridge Rd
- 5180 Packard Dr
- 4651 Kautz Dr
- 4672 Kautz Dr
- 4682 Kautz Dr
- 5200 Packard Dr
- 5174 Packard Dr
- 5205 Pepper Dr