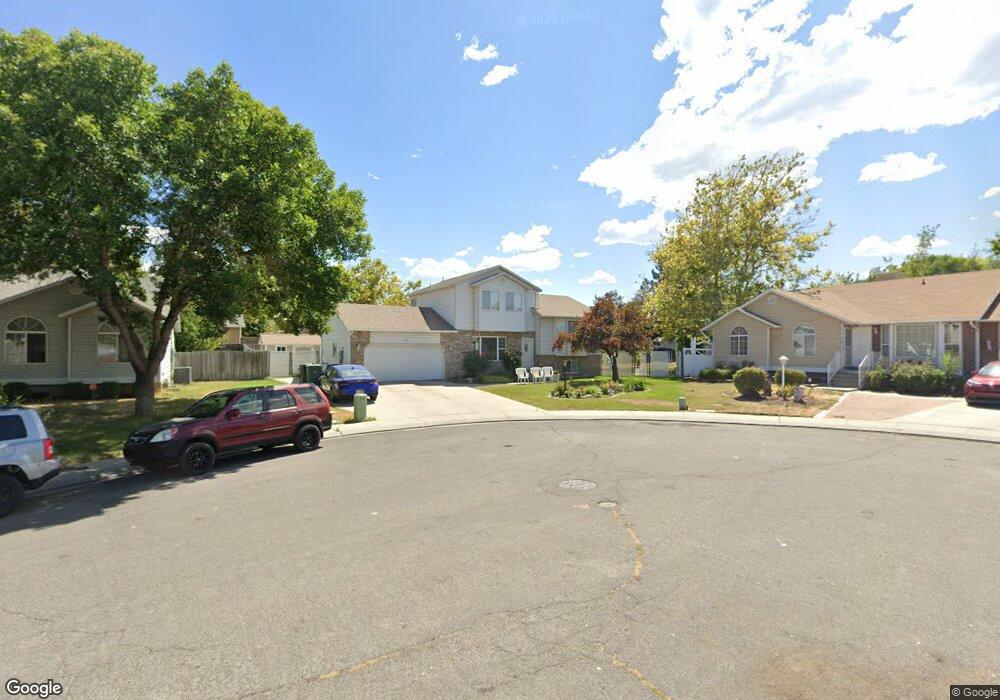
4363 W 3930 S Salt Lake City, UT 84120
Granger NeighborhoodEstimated Value: $477,000 - $509,000
3
Beds
2
Baths
1,515
Sq Ft
$325/Sq Ft
Est. Value
About This Home
This home is located at 4363 W 3930 S, Salt Lake City, UT 84120 and is currently estimated at $492,769, approximately $325 per square foot. 4363 W 3930 S is a home located in Salt Lake County with nearby schools including Philo T Farnsworth Elementary School, Valley Junior High School, and Granger High School.
Ownership History
Date
Name
Owned For
Owner Type
Purchase Details
Closed on
Oct 1, 2019
Sold by
Salmond Breck Jon and Salmond Camille Miner
Bought by
Salmond Breck Jon and Salmond Camille Joy Miner
Current Estimated Value
Purchase Details
Closed on
Apr 5, 1994
Sold by
Arbor Homes Inc
Bought by
Salmond Breck Jon and Salmond Camille Miner
Home Financials for this Owner
Home Financials are based on the most recent Mortgage that was taken out on this home.
Original Mortgage
$49,400
Interest Rate
6.86%
Mortgage Type
Purchase Money Mortgage
Create a Home Valuation Report for This Property
The Home Valuation Report is an in-depth analysis detailing your home's value as well as a comparison with similar homes in the area
Home Values in the Area
Average Home Value in this Area
Purchase History
| Date | Buyer | Sale Price | Title Company |
|---|---|---|---|
| Salmond Breck Jon | -- | None Available | |
| Salmond Breck Jon | -- | -- |
Source: Public Records
Mortgage History
| Date | Status | Borrower | Loan Amount |
|---|---|---|---|
| Closed | Salmond Breck Jon | $49,400 |
Source: Public Records
Tax History Compared to Growth
Tax History
| Year | Tax Paid | Tax Assessment Tax Assessment Total Assessment is a certain percentage of the fair market value that is determined by local assessors to be the total taxable value of land and additions on the property. | Land | Improvement |
|---|---|---|---|---|
| 2025 | $3,104 | $474,500 | $144,600 | $329,900 |
| 2024 | $3,104 | $475,600 | $140,700 | $334,900 |
| 2023 | $2,963 | $434,600 | $135,300 | $299,300 |
| 2022 | $2,876 | $423,000 | $132,600 | $290,400 |
| 2021 | $2,508 | $331,500 | $102,000 | $229,500 |
| 2020 | $2,334 | $291,200 | $95,400 | $195,800 |
| 2019 | $2,292 | $275,800 | $90,000 | $185,800 |
| 2018 | $2,209 | $256,100 | $90,000 | $166,100 |
| 2017 | $2,079 | $245,300 | $90,000 | $155,300 |
| 2016 | $1,732 | $204,600 | $90,000 | $114,600 |
| 2015 | $1,814 | $204,100 | $99,700 | $104,400 |
| 2014 | $1,777 | $195,900 | $96,700 | $99,200 |
Source: Public Records
Map
Nearby Homes
- 4308 W Volta Ave
- 4431 W 3900 S
- 4358 W 3870 S
- 4209 W 3860 S
- 4123 W 3980 S
- 4532 W 4065 S
- 3886 Atlas Way
- 5548 W 4100 S
- 3754 Brookside Dr Unit 1
- 4484 W Hercules Dr
- 4171 S 4205 W
- 3680 S 4400 W
- 4208 S 4205 W
- 3978 S 4800 W
- 3779 S 4800 W
- 4832 W 3850 S
- 3733 S Beth Park Dr Unit 130
- 4297 S 4580 W
- 4332 Losee Dr
- 4050 W Mann Way
- 4371 W 3930 S
- 4378 Volta Ave
- 4351 W 3930 S
- 4378 W Volta Ave
- 4388 W Volta Ave
- 4388 Volta Ave
- 4357 Volta Ave
- 3941 S 4400 W
- 4358 W Volta Ave
- 3939 S 4400 W
- 4398 W Volta Ave
- 4368 W 3930 S
- 4343 W 3930 S
- 4356 Volta Ave
- 4398 Volta Ave
- 4356 W 3930 S
- 3927 S 4400 W
- 4346 W 3930 S
- 4356 W Volta Ave
- 4387 Volta Ave