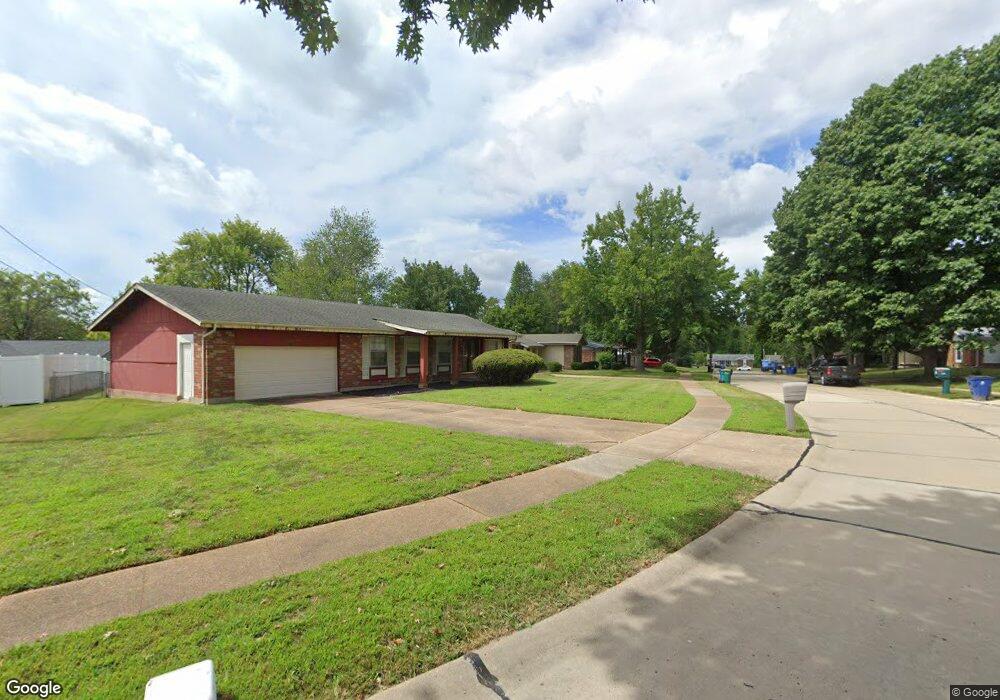
4364 Metarus Dr Florissant, MO 63033
Estimated Value: $175,480 - $202,000
3
Beds
2
Baths
1,080
Sq Ft
$172/Sq Ft
Est. Value
About This Home
This home is located at 4364 Metarus Dr, Florissant, MO 63033 and is currently estimated at $185,370, approximately $171 per square foot. 4364 Metarus Dr is a home located in St. Louis County with nearby schools including Jury Elementary School, Central Middle School, and Hazelwood Central High School.
Ownership History
Date
Name
Owned For
Owner Type
Purchase Details
Closed on
Apr 22, 2013
Sold by
Chambers Roosevelt
Bought by
Flewellen Tanetra Lene
Current Estimated Value
Home Financials for this Owner
Home Financials are based on the most recent Mortgage that was taken out on this home.
Original Mortgage
$91,314
Outstanding Balance
$67,097
Interest Rate
4.4%
Mortgage Type
FHA
Estimated Equity
$118,273
Purchase Details
Closed on
Aug 8, 2012
Sold by
Secretary Of Veterans Affairs
Bought by
Chambers Roosevelt
Purchase Details
Closed on
May 8, 2012
Sold by
Obrian Anita and Obrian Donn R
Bought by
Secretary Of Veterans Affairs
Purchase Details
Closed on
Aug 29, 2001
Sold by
Wash Bobby and Gene M
Bought by
Obrian Donn and Obrian Anita
Home Financials for this Owner
Home Financials are based on the most recent Mortgage that was taken out on this home.
Original Mortgage
$91,350
Interest Rate
6.96%
Mortgage Type
VA
Create a Home Valuation Report for This Property
The Home Valuation Report is an in-depth analysis detailing your home's value as well as a comparison with similar homes in the area
Home Values in the Area
Average Home Value in this Area
Purchase History
| Date | Buyer | Sale Price | Title Company |
|---|---|---|---|
| Flewellen Tanetra Lene | $93,000 | Investors Title Co Clayton | |
| Chambers Roosevelt | $38,100 | Us Title Main | |
| Secretary Of Veterans Affairs | $39,658 | None Available | |
| Obrian Donn | $91,900 | -- |
Source: Public Records
Mortgage History
| Date | Status | Borrower | Loan Amount |
|---|---|---|---|
| Open | Flewellen Tanetra Lene | $91,314 | |
| Previous Owner | Obrian Donn | $91,350 |
Source: Public Records
Tax History Compared to Growth
Tax History
| Year | Tax Paid | Tax Assessment Tax Assessment Total Assessment is a certain percentage of the fair market value that is determined by local assessors to be the total taxable value of land and additions on the property. | Land | Improvement |
|---|---|---|---|---|
| 2025 | $2,522 | $32,550 | $4,810 | $27,740 |
| 2024 | $2,522 | $27,660 | $3,210 | $24,450 |
| 2023 | $4,338 | $27,660 | $3,210 | $24,450 |
| 2022 | $4,240 | $23,730 | $5,620 | $18,110 |
| 2021 | $4,111 | $23,730 | $5,620 | $18,110 |
| 2020 | $3,935 | $20,390 | $3,690 | $16,700 |
| 2019 | $3,900 | $20,390 | $3,690 | $16,700 |
| 2018 | $2,011 | $18,170 | $2,570 | $15,600 |
| 2017 | $2,008 | $18,170 | $2,570 | $15,600 |
| 2016 | $2,016 | $17,940 | $2,890 | $15,050 |
| 2015 | $1,970 | $17,940 | $2,890 | $15,050 |
| 2014 | $1,635 | $14,780 | $2,870 | $11,910 |
Source: Public Records
Map
Nearby Homes
- 4354 Metarus Dr
- 4348 Vandals Dr
- 11790 New Halls Ferry Rd
- 4327 Sulla Dr
- 12062 Cato Dr
- 4493 Caracalla Dr
- 11767 MacRinus Dr
- 4384 Remus Dr
- 11636 MacRinus Dr
- 4401 Rhine Dr
- 4461 Rhine Dr
- 4471 Rhine Dr
- 11540 Lares Dr
- 4244 Miletus Dr
- 11869 Galba Dr
- 3905 Max-Weich Place
- 11565 Mehl Ave
- 4497 Rhine Dr
- 4040 Helmkampf Dr
- 11830 7 Hills Dr
- 4374 Metarus Dr
- 11911 Cato Dr
- 11901 Cato Dr
- 4334 Metarus Dr
- 4394 Metarus Dr
- 4355 Metarus Dr
- 4365 Metarus Dr
- 11891 Cato Dr
- 4345 Metarus Dr
- 4314 Metarus Dr
- 4375 Metarus Dr
- 4335 Metarus Dr
- 4385 Metarus Dr
- 11881 Cato Dr
- 11941 Cato Dr
- 11852 Cato Dr
- 4338 Varano Dr
- 11922 Cato Dr
- 4315 Metarus Dr
- 4348 Varano Dr