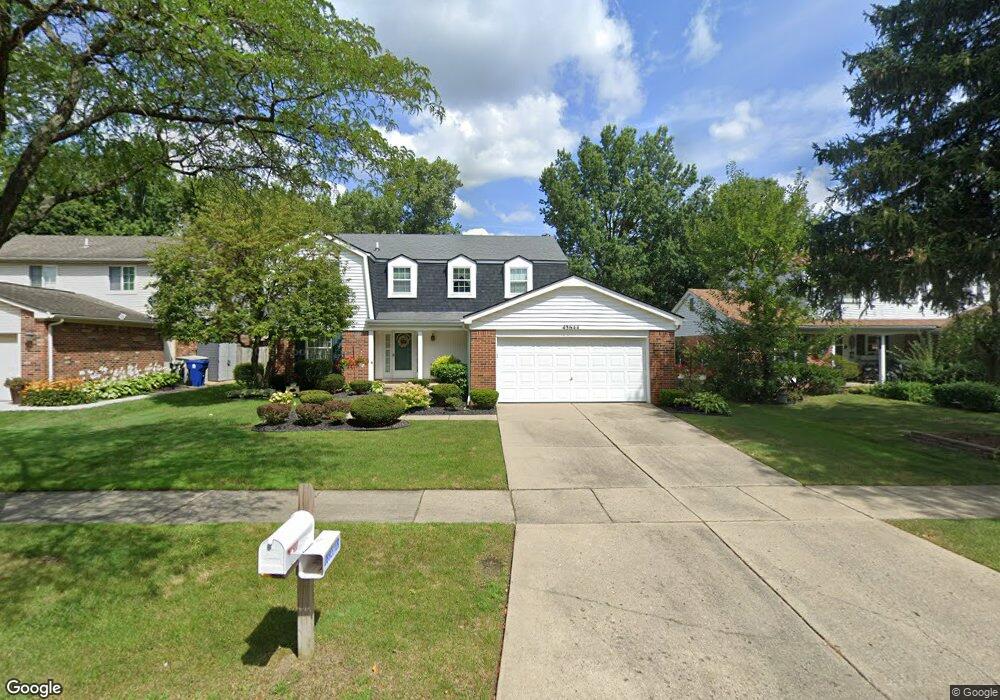
43644 Gatehouse Ct Canton, MI 48187
Estimated Value: $381,733 - $462,000
Studio
3
Baths
2,076
Sq Ft
$204/Sq Ft
Est. Value
About This Home
This home is located at 43644 Gatehouse Ct, Canton, MI 48187 and is currently estimated at $423,683, approximately $204 per square foot. 43644 Gatehouse Ct is a home located in Wayne County with nearby schools including Canton High School, Salem High School, and East Middle School.
Ownership History
Date
Name
Owned For
Owner Type
Purchase Details
Closed on
May 20, 2009
Sold by
Uryga Elaine M and Uryga Walter P
Bought by
Uryga Elaine M and Revocable Trust Agreement Of Walter Uryg
Current Estimated Value
Purchase Details
Closed on
Mar 31, 2006
Sold by
Uryga Walter P and Uryga Elaine M
Bought by
Uryga Walter P
Home Financials for this Owner
Home Financials are based on the most recent Mortgage that was taken out on this home.
Original Mortgage
$246,600
Outstanding Balance
$115,199
Interest Rate
3.25%
Mortgage Type
Stand Alone Refi Refinance Of Original Loan
Estimated Equity
$308,484
Purchase Details
Closed on
Apr 11, 2003
Sold by
The Revocable Trust Of Walter Uryga Jr & and Uryga The Revocable
Bought by
Uryga Walter P
Home Financials for this Owner
Home Financials are based on the most recent Mortgage that was taken out on this home.
Original Mortgage
$192,000
Interest Rate
5.71%
Mortgage Type
Balloon
Purchase Details
Closed on
Oct 15, 2002
Sold by
Uayga Elaine M
Bought by
Uryga Walter
Create a Home Valuation Report for This Property
The Home Valuation Report is an in-depth analysis detailing your home's value as well as a comparison with similar homes in the area
Home Values in the Area
Average Home Value in this Area
Purchase History
| Date | Buyer | Sale Price | Title Company |
|---|---|---|---|
| Uryga Elaine M | -- | None Available | |
| Uryga Walter P | -- | Fidelity National Title | |
| Uryga Walter P | -- | Lawyers Title Insurance Co | |
| Uryga Walter | -- | -- |
Source: Public Records
Mortgage History
| Date | Status | Borrower | Loan Amount |
|---|---|---|---|
| Open | Uryga Walter P | $246,600 | |
| Closed | Uryga Walter P | $192,000 |
Source: Public Records
Tax History
| Year | Tax Paid | Tax Assessment Tax Assessment Total Assessment is a certain percentage of the fair market value that is determined by local assessors to be the total taxable value of land and additions on the property. | Land | Improvement |
|---|---|---|---|---|
| 2025 | $2,047 | $200,000 | $0 | $0 |
| 2024 | $1,989 | $180,400 | $0 | $0 |
| 2023 | $1,896 | $164,500 | $0 | $0 |
| 2022 | $4,168 | $142,100 | $0 | $0 |
| 2021 | $4,055 | $135,500 | $0 | $0 |
| 2020 | $3,993 | $135,600 | $0 | $0 |
| 2019 | $3,927 | $125,910 | $0 | $0 |
| 2018 | $1,612 | $126,520 | $0 | $0 |
| 2017 | $4,011 | $123,100 | $0 | $0 |
| 2016 | $3,570 | $123,400 | $0 | $0 |
| 2015 | $8,856 | $112,050 | $0 | $0 |
| 2013 | $8,579 | $91,440 | $0 | $0 |
| 2010 | -- | $91,550 | $45,596 | $45,954 |
Source: Public Records
Map
Nearby Homes
- 43529 Oakbrook Rd
- 8830 Northern Ave
- 8815 Marlowe Ave
- 43086 Versailles Rd
- 8887 Morrison Ave
- 9011 Elmhurst Ave
- 9048 Brookline Ave
- 0 Joy Rd Unit Parcel 3
- 0 Joy Rd Unit Parcel 2
- 0 Joy Rd Unit Parcel B
- 0 Joy Rd Unit Parcel A
- 9021 Elmhurst Ave
- 44570 Tillotson Dr
- 7925 N Sheldon Rd
- 44805 Joy Rd
- 9453 Brookline Ave
- 990 Ross St
- 44432 Newburyport Dr
- 600 Ross St
- 500 Ross St
- 43672 Gatehouse Ct
- 43700 Gatehouse Ct
- 43588 Gatehouse Ct
- 43568 Gatehouse Ct
- 43629 Gatehouse Ct
- 43657 Gatehouse Ct
- 43601 Gatehouse Ct
- 8444 Congress Dr
- 8468 Congress Dr
- 43685 Gatehouse Ct
- 8420 Congress Dr
- 8492 Congress Dr
- 43571 Gatehouse Ct
- 43532 Gatehouse Ct
- 43713 Gatehouse Ct
- 8516 Congress Dr
- 43537 Gatehouse Ct
- 43612 Oakbrook Rd
- 43640 Oakbrook Rd
- 43584 Oakbrook Rd
Your Personal Tour Guide
Ask me questions while you tour the home.