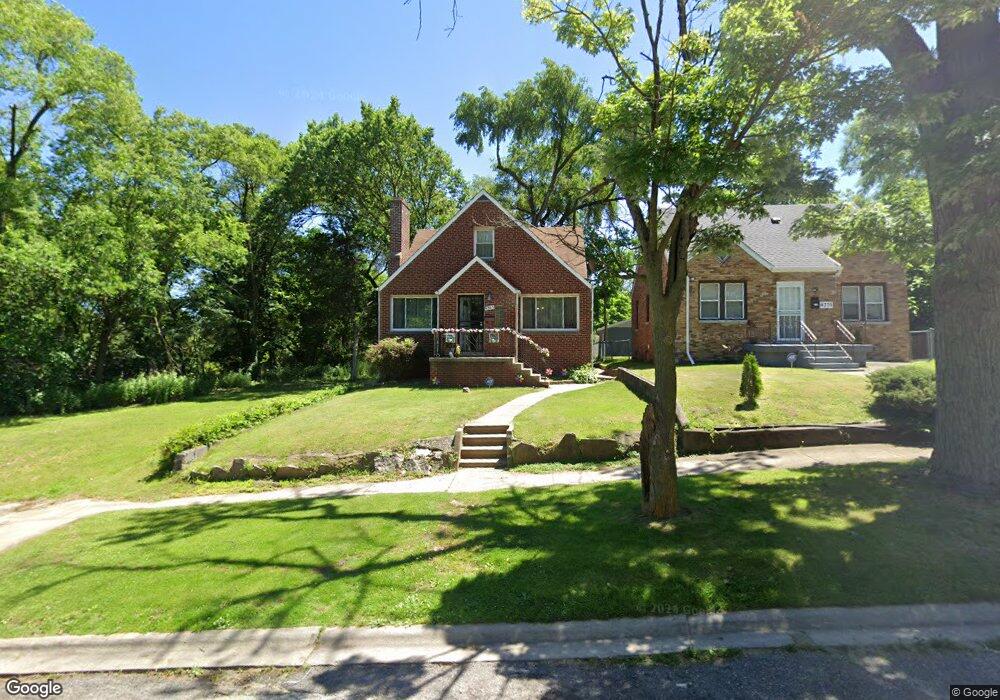
4365 Jackson St Gary, IN 46408
Glen Park NeighborhoodEstimated Value: $157,000 - $183,000
4
Beds
2
Baths
2,205
Sq Ft
$76/Sq Ft
Est. Value
About This Home
This home is located at 4365 Jackson St, Gary, IN 46408 and is currently estimated at $168,250, approximately $76 per square foot. 4365 Jackson St is a home located in Lake County with nearby schools including Glen Park Academy for Excellence in Learning, Bailly Preparatory Academy, and West Side Leadership Academy.
Ownership History
Date
Name
Owned For
Owner Type
Purchase Details
Closed on
Mar 24, 2021
Sold by
King Isiah and Scott King Nadine
Bought by
Wiggins Lorri
Current Estimated Value
Purchase Details
Closed on
Mar 22, 2021
Sold by
King Isiah and Scott-King Nadine
Bought by
Wiggins Lorri
Purchase Details
Closed on
Sep 28, 2010
Sold by
Whttp Llc
Bought by
King Isiah and Scott King Nadine
Purchase Details
Closed on
Sep 22, 2010
Sold by
Secretary Of Housing & Urban Development
Bought by
Whttp Llc
Purchase Details
Closed on
Oct 19, 2009
Sold by
Countrywide Home Loans Inc
Bought by
The Secretary Of Housing & Urban Develop
Purchase Details
Closed on
Sep 5, 2008
Sold by
Rogers Roderick
Bought by
Countrywide Home Loans Inc
Purchase Details
Closed on
Aug 29, 2005
Sold by
Foster Nicole
Bought by
Rogers Roderick
Home Financials for this Owner
Home Financials are based on the most recent Mortgage that was taken out on this home.
Original Mortgage
$68,918
Interest Rate
5.89%
Mortgage Type
FHA
Create a Home Valuation Report for This Property
The Home Valuation Report is an in-depth analysis detailing your home's value as well as a comparison with similar homes in the area
Home Values in the Area
Average Home Value in this Area
Purchase History
| Date | Buyer | Sale Price | Title Company |
|---|---|---|---|
| Wiggins Lorri | -- | None Available | |
| Wiggins Lorri | -- | None Listed On Document | |
| King Isiah | -- | Meridian Title Corp | |
| Whttp Llc | -- | Meridian Title Corp | |
| The Secretary Of Housing & Urban Develop | -- | None Available | |
| Countrywide Home Loans Inc | $80,730 | None Available | |
| Rogers Roderick | -- | Chicago Title Insurance Comp |
Source: Public Records
Mortgage History
| Date | Status | Borrower | Loan Amount |
|---|---|---|---|
| Previous Owner | Rogers Roderick | $68,918 |
Source: Public Records
Tax History
| Year | Tax Paid | Tax Assessment Tax Assessment Total Assessment is a certain percentage of the fair market value that is determined by local assessors to be the total taxable value of land and additions on the property. | Land | Improvement |
|---|---|---|---|---|
| 2025 | $1,016 | $127,100 | $6,900 | $120,200 |
| 2024 | $7,124 | $87,600 | $5,700 | $81,900 |
| 2023 | $921 | $80,800 | $5,700 | $75,100 |
| 2022 | $921 | $79,500 | $3,800 | $75,700 |
| 2021 | $834 | $74,200 | $3,800 | $70,400 |
| 2020 | $788 | $70,200 | $3,800 | $66,400 |
| 2019 | $844 | $73,900 | $3,900 | $70,000 |
| 2018 | $911 | $78,300 | $4,000 | $74,300 |
| 2017 | $900 | $76,700 | $4,000 | $72,700 |
| 2016 | $1,893 | $83,900 | $4,000 | $79,900 |
| 2014 | $2,048 | $87,500 | $4,700 | $82,800 |
| 2013 | $1,953 | $86,900 | $4,700 | $82,200 |
Source: Public Records
Map
Nearby Homes
- 4383 Monroe St
- 4265 Van Buren St
- 4317 Harrison St
- 4257 Van Buren St
- 4270 Madison St
- 4200 Monroe St
- 4181 Monroe St
- 4365 Adams St
- 4343 Adams St
- 4169 Monroe St
- 132 W 43rd Ave
- 4525 Tyler St
- 4354 Washington St
- 4427 Washington St
- 4017 Polk St
- 4556 Polk St
- 4647 Harrison St
- 234 W 41st Ave
- 4181 Fillmore St
- 4656 Jefferson Place
- 4375 Jackson St
- 4359 Jackson St
- 4381 Jackson St
- 4347 Jackson St
- 4385 Jackson St
- 4345 Jackson St
- 4368 Monroe St
- 4360 Monroe St
- 4374 Monroe St
- 4360 Jackson St
- 4395 Jackson St
- 4339 Jackson St
- 4384 Monroe St
- 604 W 44th Ave
- 4342 Monroe St
- 611 W 43rd Place
- 4335 Jackson St
- 608 W 44th Ave
- 4336 Monroe St
- 512 W 44th Ave
Your Personal Tour Guide
Ask me questions while you tour the home.