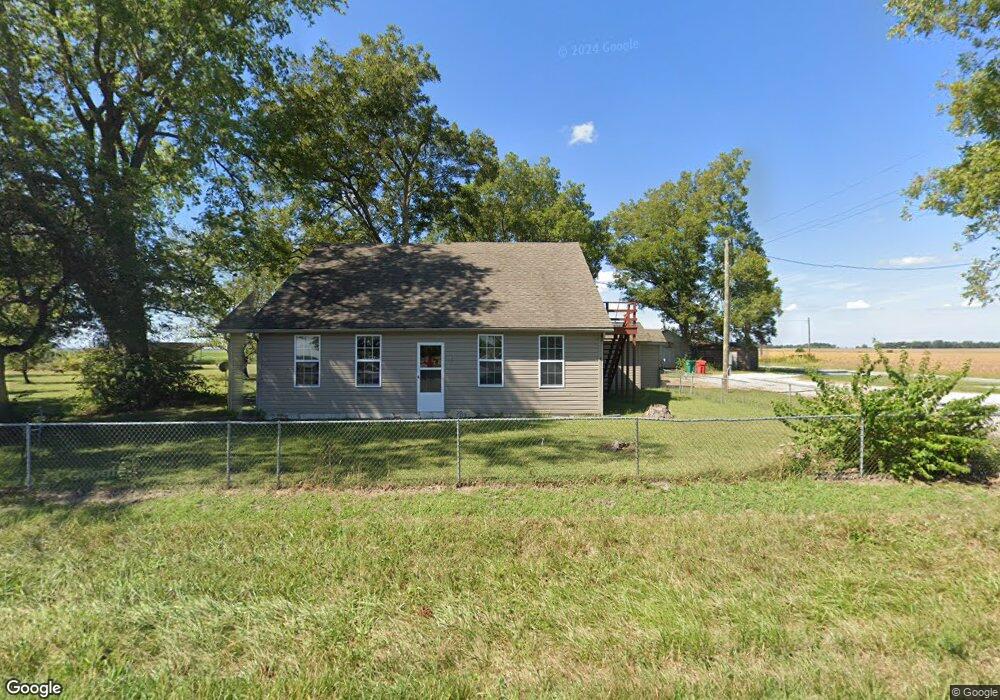
4365 State Route 13 Freeburg, IL 62243
Estimated Value: $136,000 - $437,000
3
Beds
2
Baths
2,410
Sq Ft
$97/Sq Ft
Est. Value
About This Home
This home is located at 4365 State Route 13, Freeburg, IL 62243 and is currently estimated at $234,802, approximately $97 per square foot. 4365 State Route 13 is a home located in St. Clair County with nearby schools including Freeburg Elementary School, Freeburg Community High School, and St. Joseph Catholic School.
Ownership History
Date
Name
Owned For
Owner Type
Purchase Details
Closed on
Mar 31, 2022
Sold by
Helfrich David and Helfrich Charlene
Bought by
Cox Edward D and Cox Jennifer L
Current Estimated Value
Home Financials for this Owner
Home Financials are based on the most recent Mortgage that was taken out on this home.
Original Mortgage
$109,840
Outstanding Balance
$102,809
Interest Rate
3.92%
Mortgage Type
New Conventional
Estimated Equity
$131,993
Purchase Details
Closed on
Jul 27, 2005
Sold by
Helfrich Lilly E
Bought by
Helfrich David and Helfrich Charlene
Home Financials for this Owner
Home Financials are based on the most recent Mortgage that was taken out on this home.
Original Mortgage
$65,000
Interest Rate
5.74%
Mortgage Type
Fannie Mae Freddie Mac
Create a Home Valuation Report for This Property
The Home Valuation Report is an in-depth analysis detailing your home's value as well as a comparison with similar homes in the area
Home Values in the Area
Average Home Value in this Area
Purchase History
| Date | Buyer | Sale Price | Title Company |
|---|---|---|---|
| Cox Edward D | $137,500 | Town & Country Title | |
| Helfrich David | $85,000 | Metro East Title |
Source: Public Records
Mortgage History
| Date | Status | Borrower | Loan Amount |
|---|---|---|---|
| Open | Cox Edward D | $109,840 | |
| Previous Owner | Helfrich David | $65,000 |
Source: Public Records
Tax History Compared to Growth
Tax History
| Year | Tax Paid | Tax Assessment Tax Assessment Total Assessment is a certain percentage of the fair market value that is determined by local assessors to be the total taxable value of land and additions on the property. | Land | Improvement |
|---|---|---|---|---|
| 2024 | -- | $48,783 | $1,813 | $46,970 |
| 2023 | $3,159 | $46,023 | $1,768 | $44,255 |
| 2022 | $649 | $42,018 | $1,614 | $40,404 |
| 2021 | $3,299 | $39,861 | $1,531 | $38,330 |
| 2020 | $3,269 | $41,356 | $1,588 | $39,768 |
| 2019 | $3,090 | $37,249 | $1,516 | $35,733 |
| 2018 | $3,149 | $38,322 | $1,560 | $36,762 |
| 2017 | $3,054 | $37,396 | $1,522 | $35,874 |
| 2016 | $3,023 | $37,474 | $1,525 | $35,949 |
| 2014 | $2,821 | $38,215 | $1,607 | $36,608 |
| 2013 | $2,227 | $39,770 | $1,672 | $38,098 |
Source: Public Records
Map
Nearby Homes
- 103 Draco Dr
- 109 Willow Dr
- 111 Willow Dr
- 0 Hickory Dr
- tbb Illinois 15
- 3 Park St
- 0 Five Forks Rd
- 106 S Vine St
- TBB Kraft Rd
- 312 W Phillips St
- 206 N Main St
- 207 N Edison St
- 304 Torrington Ln
- 302 N Railroad St
- 401 N Edison St
- 222 Alamosa Dr
- 227 Alamosa Dr
- 359 Sleeping Indian Dr
- 363 Sleeping Indian Dr
- 420 Foxtail Dr
- 4353 State Route 13
- 7517 Blacksmith Shop Rd
- 4315 State Route 13
- 4263 State Route 13
- 4221 State Route 13
- 7339 Blacksmith Shop Rd
- 7639 Red Ray Mine Rd
- 7325 Blacksmith Shop Rd
- 7671 Red Ray Mine Rd
- 7683 Red Ray Mine Rd
- 7531 Red Ray Mine Rd
- 7258 Blacksmith Shop Rd
- 7517 Red Ray Mine Rd
- 7767 Red Ray Mine Rd
- 7601 Five Forks Rd
- 7505 Red Ray Mine Rd
- 7761 Red Ray Mine Rd
- 7223 Blacksmith Shop Rd
- 4744 State Route 13
- 7575 Robinson School Rd