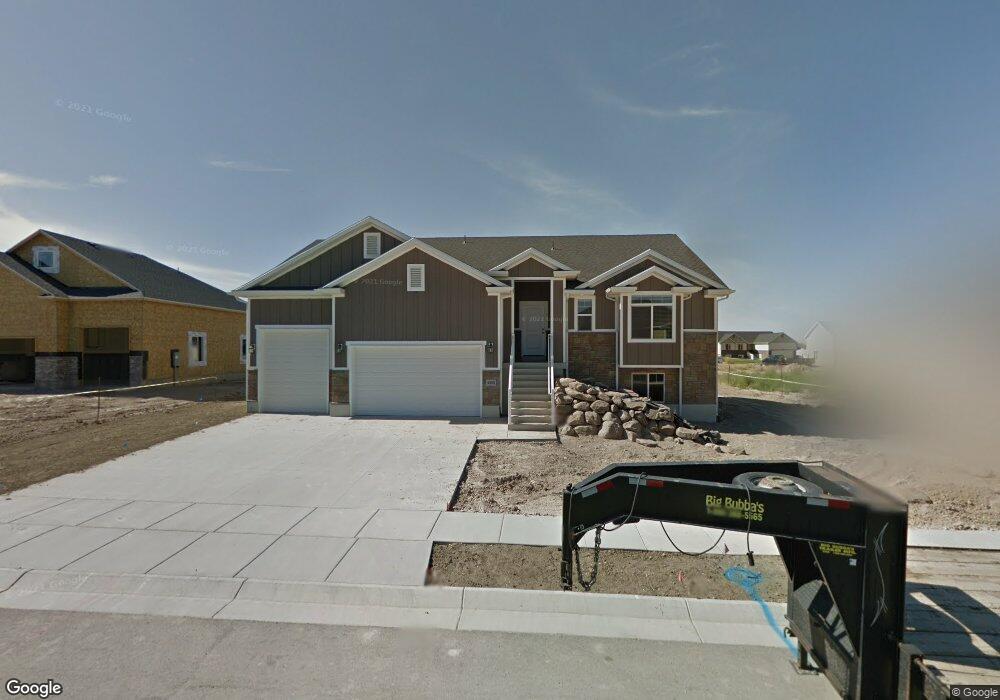
4365 W 5700 S Hooper, UT 84315
Estimated Value: $620,000 - $703,000
5
Beds
3
Baths
1,612
Sq Ft
$404/Sq Ft
Est. Value
About This Home
This home is located at 4365 W 5700 S, Hooper, UT 84315 and is currently estimated at $651,882, approximately $404 per square foot. 4365 W 5700 S is a home located in Weber County with nearby schools including Freedom School, Roy Junior High School, and Roy High School.
Ownership History
Date
Name
Owned For
Owner Type
Purchase Details
Closed on
Aug 30, 2016
Sold by
Shephard Steven and Shephard Alisha
Bought by
Shepherd Steven and Shepherd Alisha
Current Estimated Value
Home Financials for this Owner
Home Financials are based on the most recent Mortgage that was taken out on this home.
Original Mortgage
$160,500
Outstanding Balance
$72,217
Interest Rate
2.75%
Mortgage Type
New Conventional
Estimated Equity
$579,665
Purchase Details
Closed on
Jun 12, 2012
Sold by
Castle Creek Homes Llc
Bought by
Shepherd Steven and Shepherd Alisha
Home Financials for this Owner
Home Financials are based on the most recent Mortgage that was taken out on this home.
Original Mortgage
$180,000
Interest Rate
3.79%
Mortgage Type
New Conventional
Purchase Details
Closed on
May 10, 2010
Sold by
Hooper 22 Llc
Bought by
Cache Valley Bank
Create a Home Valuation Report for This Property
The Home Valuation Report is an in-depth analysis detailing your home's value as well as a comparison with similar homes in the area
Home Values in the Area
Average Home Value in this Area
Purchase History
| Date | Buyer | Sale Price | Title Company |
|---|---|---|---|
| Shepherd Steven | -- | Real Advantage Title Ins Ag | |
| Shepherd Steven | -- | Mountain View Title Ogden | |
| Cache Valley Bank | -- | Cache Title Logan |
Source: Public Records
Mortgage History
| Date | Status | Borrower | Loan Amount |
|---|---|---|---|
| Open | Shepherd Steven | $160,500 | |
| Previous Owner | Shepherd Steven | $180,000 |
Source: Public Records
Tax History
| Year | Tax Paid | Tax Assessment Tax Assessment Total Assessment is a certain percentage of the fair market value that is determined by local assessors to be the total taxable value of land and additions on the property. | Land | Improvement |
|---|---|---|---|---|
| 2025 | $3,822 | $615,389 | $224,375 | $391,014 |
| 2024 | $3,688 | $332,199 | $123,406 | $208,793 |
| 2023 | $3,893 | $349,800 | $123,427 | $226,373 |
| 2022 | $3,686 | $339,350 | $98,705 | $240,645 |
| 2021 | $3,293 | $510,000 | $114,364 | $395,636 |
| 2020 | $2,958 | $419,000 | $99,455 | $319,545 |
| 2019 | $3,005 | $403,000 | $69,638 | $333,362 |
| 2018 | $2,877 | $368,000 | $69,638 | $298,362 |
| 2017 | $2,671 | $329,000 | $59,777 | $269,223 |
| 2016 | $2,506 | $165,988 | $32,902 | $133,086 |
| 2015 | $2,448 | $159,651 | $32,902 | $126,749 |
| 2014 | $2,155 | $135,349 | $24,166 | $111,183 |
Source: Public Records
Map
Nearby Homes
- 4365 W 5700 S Unit 31
- 4343 W 5700 S
- 4343 W 5700 S Unit 32
- 4377 W 5700 S
- 4377 W 5700 S Unit 30
- 4364 W 5750 S
- 4364 W 5750 S Unit 25
- 4346 W 5750 S
- 4346 W 5750 S Unit 26
- 4378 W 5750 S
- 4378 W 5750 S Unit 24
- 4332 W 5750 S
- 4332 W 5750 S Unit 27
- 5712 S 4400 W
- 4368 W 5700 S
- 4354 W 5700 S
- 4354 W 5700 S Unit 36
- 4321 W 5700 S
- 4321 W 5700 S Unit 33
- 4388 W 5750 S Unit 23
Your Personal Tour Guide
Ask me questions while you tour the home.