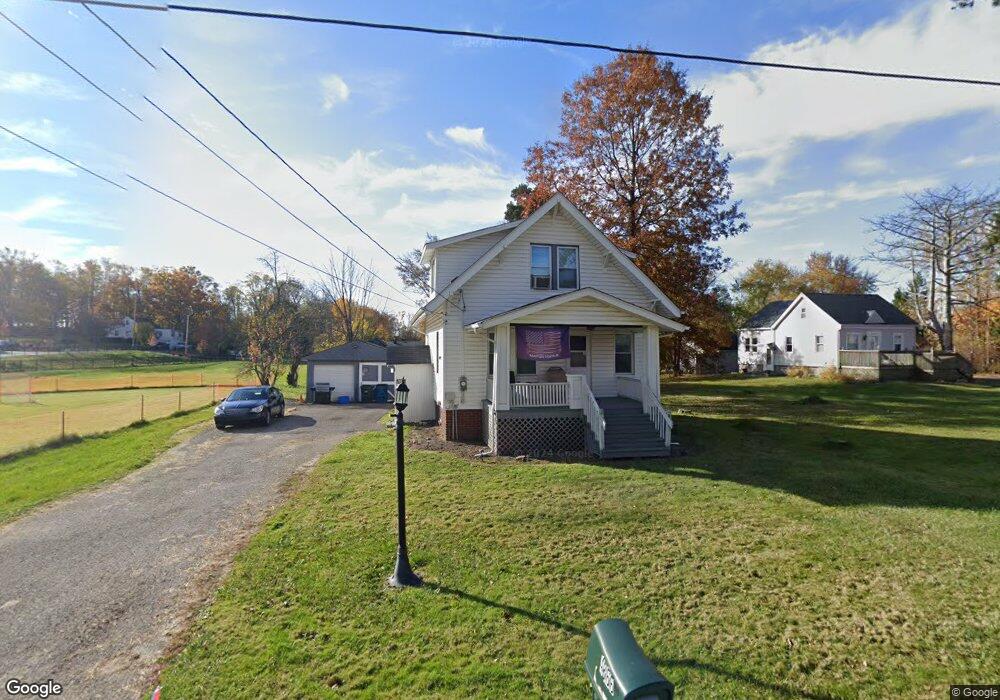
4366 Kimmich Dr Brunswick, OH 44212
Estimated Value: $201,000 - $220,000
2
Beds
2
Baths
862
Sq Ft
$241/Sq Ft
Est. Value
About This Home
This home is located at 4366 Kimmich Dr, Brunswick, OH 44212 and is currently estimated at $208,000, approximately $241 per square foot. 4366 Kimmich Dr is a home located in Medina County with nearby schools including C.R. Towslee Elementary School, Willets Middle School, and Brunswick High School.
Ownership History
Date
Name
Owned For
Owner Type
Purchase Details
Closed on
Jul 18, 2022
Sold by
Dorob Holdings Llc
Bought by
Ambrose Properties New England Llc
Current Estimated Value
Home Financials for this Owner
Home Financials are based on the most recent Mortgage that was taken out on this home.
Original Mortgage
$675,000
Outstanding Balance
$642,186
Interest Rate
5.09%
Mortgage Type
New Conventional
Estimated Equity
-$434,186
Purchase Details
Closed on
Nov 12, 2015
Sold by
Skubon George R and Castek Skubon Patsy L
Bought by
Skubon George R and Castek Skubon Patsy L
Purchase Details
Closed on
Dec 19, 2008
Sold by
Keller Forrest C
Bought by
Castek Patsy L
Home Financials for this Owner
Home Financials are based on the most recent Mortgage that was taken out on this home.
Original Mortgage
$54,400
Interest Rate
6.06%
Mortgage Type
Future Advance Clause Open End Mortgage
Create a Home Valuation Report for This Property
The Home Valuation Report is an in-depth analysis detailing your home's value as well as a comparison with similar homes in the area
Home Values in the Area
Average Home Value in this Area
Purchase History
| Date | Buyer | Sale Price | Title Company |
|---|---|---|---|
| Ambrose Properties New England Llc | -- | None Listed On Document | |
| Skubon George R | -- | Tta | |
| Castek Patsy L | $68,000 | -- |
Source: Public Records
Mortgage History
| Date | Status | Borrower | Loan Amount |
|---|---|---|---|
| Open | Ambrose Properties New England Llc | $675,000 | |
| Previous Owner | Castek Patsy L | $54,400 |
Source: Public Records
Tax History Compared to Growth
Tax History
| Year | Tax Paid | Tax Assessment Tax Assessment Total Assessment is a certain percentage of the fair market value that is determined by local assessors to be the total taxable value of land and additions on the property. | Land | Improvement |
|---|---|---|---|---|
| 2024 | $2,800 | $42,000 | $36,380 | $5,620 |
| 2023 | $2,800 | $42,000 | $36,380 | $5,620 |
| 2022 | $2,302 | $42,000 | $36,380 | $5,620 |
| 2021 | $2,043 | $23,990 | $19,600 | $4,390 |
| 2020 | $1,360 | $23,990 | $19,600 | $4,390 |
| 2019 | $1,361 | $23,990 | $19,600 | $4,390 |
| 2018 | $1,173 | $19,890 | $17,810 | $2,080 |
| 2017 | $1,175 | $19,890 | $17,810 | $2,080 |
| 2016 | $1,176 | $19,890 | $17,810 | $2,080 |
| 2015 | $1,106 | $18,760 | $16,800 | $1,960 |
| 2014 | $1,103 | $18,760 | $16,800 | $1,960 |
| 2013 | $1,105 | $18,760 | $16,800 | $1,960 |
Source: Public Records
Map
Nearby Homes
- 4347 Oak Ridge Trail
- 4351 Oak Ridge Trail
- 4355 Oak Ridge Trail
- 4339 Oak Ridge Trail
- 4340 Oak Ridge Trail
- 4431 Oak Ridge Trail
- 4332 Oak Ridge Trail
- 858 Quinebaug Ct
- 4259 Pelham Way
- 1044-1070 Pearl Rd
- 4597 Brushwood Cir
- 4383 Inner Circle Dr Unit C24
- 4383 Inner Circle Dr Unit A24
- 4385 Inner Circle Dr Unit B-18
- 4383 Inner Circle Dr Unit B22
- 4349 Inner Circle Dr Unit A-5
- 1200 Queens Ave Unit 31
- 4647 Boxwood Dr
- 4203 Regal Ave
- 4224 Maiden Ct
- Kimmich Dr
- 4376 Kimmich Dr
- 4373 Kimmich Dr
- 4361 Kimmich Dr
- 954 Woodward Dr
- 4363 Homestead Dr
- 940 Woodward Dr
- 4373 Homestead Dr
- 4381 Homestead Dr
- 4389 Homestead Dr
- 926 Woodward Dr
- 956 Pearl Rd
- 966 Pearl Rd
- 976 Pearl Rd
- 982 Pearl Rd
- 4401 Homestead Dr
- 4401 Homestead Dr
- 0 Kimmich Woodward Dr Unit 4201509
- 922 Pearl Rd
- 4344 Homestead Dr