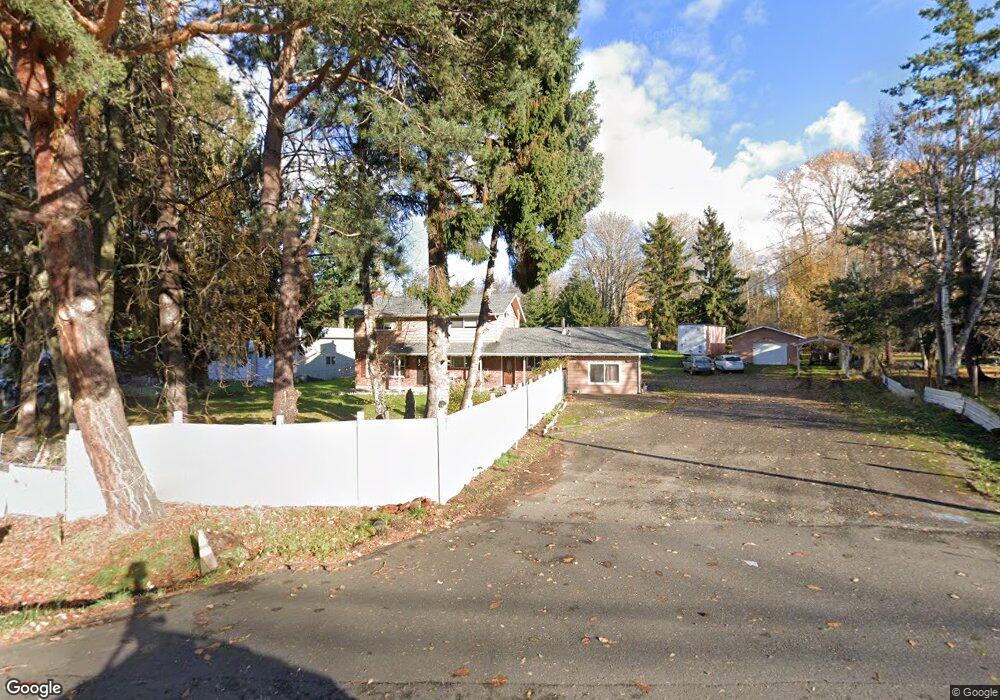
4366 Northwest Dr Bellingham, WA 98226
Estimated Value: $696,265 - $798,000
4
Beds
2
Baths
2,400
Sq Ft
$309/Sq Ft
Est. Value
About This Home
This home is located at 4366 Northwest Dr, Bellingham, WA 98226 and is currently estimated at $742,066, approximately $309 per square foot. 4366 Northwest Dr is a home located in Whatcom County with nearby schools including Cordata Elementary School, Shuksan Middle School, and Squalicum High School.
Ownership History
Date
Name
Owned For
Owner Type
Purchase Details
Closed on
Nov 19, 2021
Sold by
Dhaliwal Arvind
Bought by
Dhaliwal Harjit
Current Estimated Value
Purchase Details
Closed on
Jul 17, 2017
Sold by
Dhaliwal Harjit K
Bought by
Dhaliwal Arvind
Purchase Details
Closed on
Dec 18, 2002
Sold by
Centex Home Equity Co Llc
Bought by
Dhaliwal Harjit K
Home Financials for this Owner
Home Financials are based on the most recent Mortgage that was taken out on this home.
Original Mortgage
$174,600
Interest Rate
6.03%
Purchase Details
Closed on
Apr 2, 2002
Sold by
Tulett Gregory A and Tulett Laura D
Bought by
Centex Home Equity Company Llc and Centex Home Equity Corp
Create a Home Valuation Report for This Property
The Home Valuation Report is an in-depth analysis detailing your home's value as well as a comparison with similar homes in the area
Home Values in the Area
Average Home Value in this Area
Purchase History
| Date | Buyer | Sale Price | Title Company |
|---|---|---|---|
| Dhaliwal Harjit | -- | None Available | |
| Dhaliwal Arvind | -- | None Available | |
| Dhaliwal Harjit K | -- | Whatcom Land Title | |
| Centex Home Equity Company Llc | $197,000 | Stewart Title Company |
Source: Public Records
Mortgage History
| Date | Status | Borrower | Loan Amount |
|---|---|---|---|
| Closed | Dhaliwal Harjit K | $174,600 |
Source: Public Records
Tax History Compared to Growth
Tax History
| Year | Tax Paid | Tax Assessment Tax Assessment Total Assessment is a certain percentage of the fair market value that is determined by local assessors to be the total taxable value of land and additions on the property. | Land | Improvement |
|---|---|---|---|---|
| 2024 | $5,163 | $621,839 | $273,776 | $348,063 |
| 2023 | $5,163 | $593,803 | $253,556 | $340,247 |
| 2022 | $4,223 | $467,561 | $199,650 | $267,911 |
| 2021 | $4,225 | $386,414 | $165,000 | $221,414 |
| 2020 | $4,021 | $364,203 | $132,867 | $231,336 |
| 2019 | $3,715 | $346,860 | $126,540 | $220,320 |
| 2018 | $3,995 | $322,190 | $117,540 | $204,650 |
| 2017 | $3,298 | $297,520 | $108,540 | $188,980 |
| 2016 | $2,847 | $255,581 | $93,240 | $162,341 |
| 2015 | $2,913 | $237,583 | $90,000 | $147,583 |
| 2014 | -- | $236,470 | $80,794 | $155,676 |
| 2013 | -- | $238,083 | $81,200 | $156,883 |
Source: Public Records
Map
Nearby Homes
- 4420 Northwest Dr
- 4250 Braeburn Ln Unit 37
- 4479 Northwest Dr
- 4252 Northwest Dr
- 4226 Traverse Dr
- 1360 Talus Way
- 1366 Talus Way
- 1368 Talus Way
- 1370 Talus Way
- 4229 Ambrosia Ln
- 4226 Melrose Ln
- 4230 Melrose Ln
- 4232 Melrose Ln
- 4228 Melrose Ln
- 4227 Ambrosia Ln
- 4225 Ambrosia Ln
- 1210 Mahogany Ave
- 1365 Mahogany Ave
- 515 W Horton Rd
- 4314 Gale Ln
- 4376 Northwest Dr
- 4354 Northwest Dr
- 4353 Northwest Dr
- 4365 Northwest Dr
- 635 Beaumont Dr
- 611 Beaumont Dr
- 574 Larrabee Rd
- 593 Beaumont Dr
- 588 Larrabee Rd
- 4337 Northwest Dr
- 610 Beaumont Dr
- 4400 Northwest Dr
- 4329 Northwest Dr
- 4322 Northwest Dr
- 590 Beaumont Dr
- 4321 Northwest Dr
- 4409 Northwest Dr
- 4305 Northwest Dr
- 562 Larrabee Rd
- 4312 Northwest Dr