Estimated Value: $665,000 - $727,000
3
Beds
3
Baths
3,290
Sq Ft
$213/Sq Ft
Est. Value
About This Home
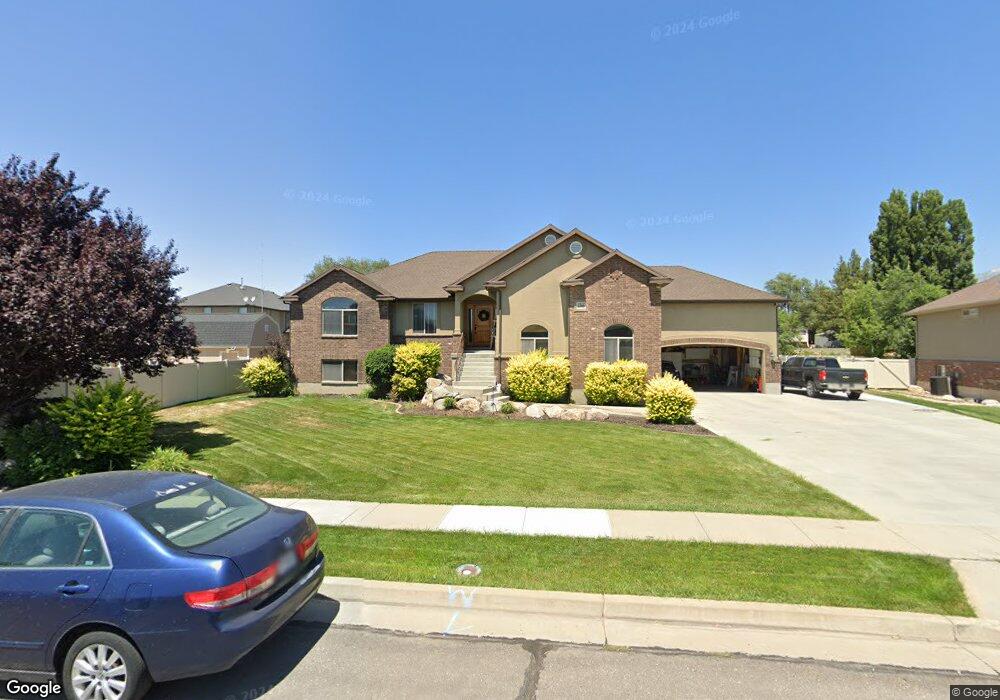
This home is located at 4366 W 1650 N, Ogden, UT 84404 and is currently estimated at $699,951, approximately $212 per square foot. 4366 W 1650 N is a home located in Weber County with nearby schools including Plain City School, Wahlquist Junior High School, and Fremont High School.
Ownership History
Date
Name
Owned For
Owner Type
Purchase Details
Closed on
Jun 19, 2020
Sold by
Trotta Travis
Bought by
Trotta Travis and Trotta Lashawn
Current Estimated Value
Home Financials for this Owner
Home Financials are based on the most recent Mortgage that was taken out on this home.
Original Mortgage
$276,000
Outstanding Balance
$206,135
Interest Rate
3.2%
Mortgage Type
Stand Alone First
Estimated Equity
$493,816
Purchase Details
Closed on
Sep 24, 2007
Sold by
Wayment Kyle C
Bought by
Trotta Travis
Home Financials for this Owner
Home Financials are based on the most recent Mortgage that was taken out on this home.
Original Mortgage
$286,650
Interest Rate
6.46%
Mortgage Type
Purchase Money Mortgage
Purchase Details
Closed on
Sep 26, 2006
Sold by
Orton Ranch Properties Llc
Bought by
Wayment Kyle C
Create a Home Valuation Report for This Property
The Home Valuation Report is an in-depth analysis detailing your home's value as well as a comparison with similar homes in the area
Home Values in the Area
Average Home Value in this Area
Purchase History
| Date | Buyer | Sale Price | Title Company |
|---|---|---|---|
| Trotta Travis | -- | Hickman Land Title Layton | |
| Trotta Travis | -- | Heritage West Title Ins | |
| Wayment Kyle C | -- | Lincoln Title Ins Agency |
Source: Public Records
Mortgage History
| Date | Status | Borrower | Loan Amount |
|---|---|---|---|
| Open | Trotta Travis | $276,000 | |
| Closed | Trotta Travis | $286,650 |
Source: Public Records
Tax History Compared to Growth
Tax History
| Year | Tax Paid | Tax Assessment Tax Assessment Total Assessment is a certain percentage of the fair market value that is determined by local assessors to be the total taxable value of land and additions on the property. | Land | Improvement |
|---|---|---|---|---|
| 2025 | $3,795 | $698,869 | $209,311 | $489,558 |
| 2024 | $3,884 | $377,848 | $115,159 | $262,689 |
| 2023 | $3,865 | $378,950 | $115,038 | $263,912 |
| 2022 | $3,949 | $400,401 | $95,431 | $304,970 |
| 2021 | $3,159 | $524,000 | $92,010 | $431,990 |
| 2020 | $2,923 | $442,000 | $82,305 | $359,695 |
| 2019 | $2,994 | $431,000 | $81,891 | $349,109 |
| 2018 | $3,087 | $429,000 | $81,891 | $347,109 |
| 2017 | $2,811 | $366,000 | $37,088 | $328,912 |
| 2016 | $2,539 | $177,809 | $39,316 | $138,493 |
| 2015 | $2,486 | $169,823 | $36,644 | $133,179 |
| 2014 | $2,324 | $153,774 | $31,145 | $122,629 |
Source: Public Records
Map
Nearby Homes
- 4227 W Pioneer Rd
- 4370 W 1500 N
- 1885 N 4475 W
- 1748 N 4100 St W
- 4210 W 1975 N
- 2131 N 4650 W
- 3966 W 2200 N
- 3622 W 2200 St N Unit 23
- 4212 W 1975 N
- 2416 N 4275 W
- 1239 N 4925 W
- 1221 N 4975 W
- 3594 W 2200 N Unit 3
- 2255 N 3600 St W Unit 21
- 2233 N 3600 St W Unit 22
- 2700 N 4200 W
- 2793 W 2775 N
- 2797 W 2775 N Unit 129
- 2782 W 2775 N Unit 105
- 2792 W 2775 N Unit 103
- 4366 W 1650 N Unit 45
- 4338 W 1650 N
- 4338 W 1650 N Unit 46
- 1682 N 4400 W
- 1682 N 4400 W Unit 1
- 1662 N 4400 W Unit 2
- 1662 N 4400 W
- 4330 W 1650 N
- 4330 W 1650 N Unit 47
- 4229 W Pioneer Rd
- 4365 W 1650 N
- 4365 W 1650 N Unit 51
- 1638 N 4400 W
- 1638 N 4400 W Unit 3
- 4225 W Pioneer Rd
- 4345 W 1650 N
- 4345 W 1650 N Unit 50
- 4286 W Pioneer Rd
- 4288 W Pioneer Rd
- 1622 N 4400 W