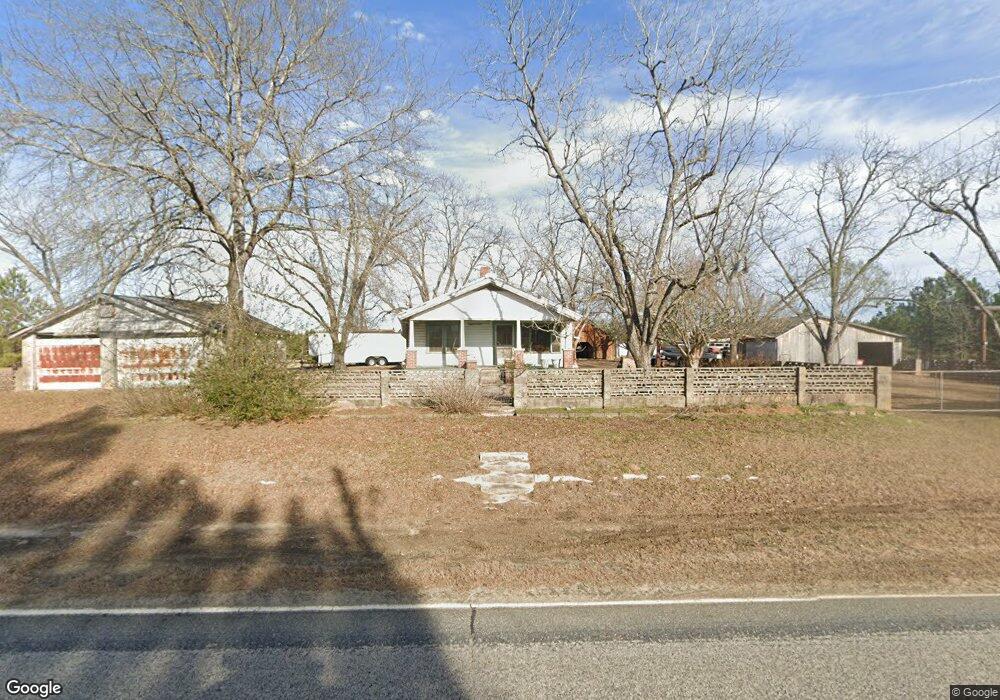
4368 Ga Highway 199 Soperton, GA 30457
Estimated Value: $117,000 - $424,542
4
Beds
1
Bath
1,416
Sq Ft
$196/Sq Ft
Est. Value
About This Home
This home is located at 4368 Ga Highway 199, Soperton, GA 30457 and is currently estimated at $276,847, approximately $195 per square foot. 4368 Ga Highway 199 is a home with nearby schools including Treutlen Elementary School and Treutlen Middle/High School.
Ownership History
Date
Name
Owned For
Owner Type
Purchase Details
Closed on
Mar 29, 2021
Sold by
Campbell Glenda Harris
Bought by
Campbell Gregory Nigel
Current Estimated Value
Purchase Details
Closed on
Jun 8, 2015
Sold by
Rk Investments Llc
Bought by
Campbell Gregory Nigel and Campbell Glenda Harris
Home Financials for this Owner
Home Financials are based on the most recent Mortgage that was taken out on this home.
Original Mortgage
$165,000
Interest Rate
3.88%
Mortgage Type
New Conventional
Purchase Details
Closed on
Apr 23, 2015
Sold by
Sanders Clarence E
Bought by
Rk Investments Llc
Home Financials for this Owner
Home Financials are based on the most recent Mortgage that was taken out on this home.
Original Mortgage
$165,000
Interest Rate
3.88%
Mortgage Type
New Conventional
Purchase Details
Closed on
Dec 3, 2003
Sold by
Rg Sanders Estate
Bought by
Sanders Clarence
Create a Home Valuation Report for This Property
The Home Valuation Report is an in-depth analysis detailing your home's value as well as a comparison with similar homes in the area
Home Values in the Area
Average Home Value in this Area
Purchase History
| Date | Buyer | Sale Price | Title Company |
|---|---|---|---|
| Campbell Gregory Nigel | -- | -- | |
| Campbell Gregory Nigel | $195,624 | -- | |
| Rk Investments Llc | $130,000 | -- | |
| Sanders Clarence | -- | -- |
Source: Public Records
Mortgage History
| Date | Status | Borrower | Loan Amount |
|---|---|---|---|
| Previous Owner | Campbell Gregory Nigel | $165,000 | |
| Previous Owner | Rk Investments Llc | $160,289 |
Source: Public Records
Tax History Compared to Growth
Tax History
| Year | Tax Paid | Tax Assessment Tax Assessment Total Assessment is a certain percentage of the fair market value that is determined by local assessors to be the total taxable value of land and additions on the property. | Land | Improvement |
|---|---|---|---|---|
| 2024 | $2,893 | $103,474 | $41,360 | $62,114 |
| 2023 | $2,418 | $103,474 | $41,360 | $62,114 |
| 2022 | $2,394 | $103,314 | $41,360 | $61,954 |
| 2021 | $961 | $50,880 | $41,360 | $9,520 |
| 2020 | $942 | $50,880 | $41,360 | $9,520 |
| 2019 | $929 | $51,084 | $41,360 | $9,724 |
| 2018 | $1,249 | $51,084 | $41,360 | $9,724 |
| 2017 | $880 | $51,084 | $41,360 | $9,724 |
| 2016 | $919 | $51,084 | $41,360 | $9,724 |
| 2015 | -- | $57,068 | $41,280 | $15,788 |
| 2014 | -- | $57,068 | $41,280 | $15,788 |
| 2013 | -- | $63,348 | $47,560 | $15,788 |
Source: Public Records
Map
Nearby Homes
- 0 County Line Rd Unit n/a 113727
- 1936 Cedar Grove Rd
- 0 Rivoli Clay Rd
- 00 Rivoli Clay Rd
- 4281 Ga Highway 46
- 4281 Sr-46
- 2166 Ga Highway 199
- 481 Windmill Way
- 1671 U S 221
- 0 Cedar Grove Rd
- 4798 S Third St
- 7586 Eastman Rd
- 1785 Martin Luther King jr Dr
- 46 Georgia 46
- 0 Hwy 297 - Tract 2 & 3
- 4004 E Louisiana Ave
- 95 Railroad Ave
- 1671 U S 221 North Hwy
- 0 Knox Mill Rd Unit 10640244
- 0 Beasley Hill Place Unit 10640367
- 4335 Ga Highway 199
- 4277 Ga Highway 199
- 4217 Ga Highway 199
- 4439 Ga Highway 199
- 4113 Ga Highway 199
- 4017 Ga Highway 199
- 258 Fairfield Ln
- 392 Fairfield Ln
- 3825 Ga Highway 199
- 3825 Georgia 199
- 3729 Ga Highway 199
- 529 Cedar Grove Rd
- 336 Cedar Grove Rd
- 3617 Ga Highway 199
- 1079 Cedar Grove Rd
- 1047 Cedar Grove Rd
- 231 Cedar Grove Rd
- 1117 Cedar Grove Rd
- 396 Cedar Grove Rd
- 298 Cedar Grove Rd