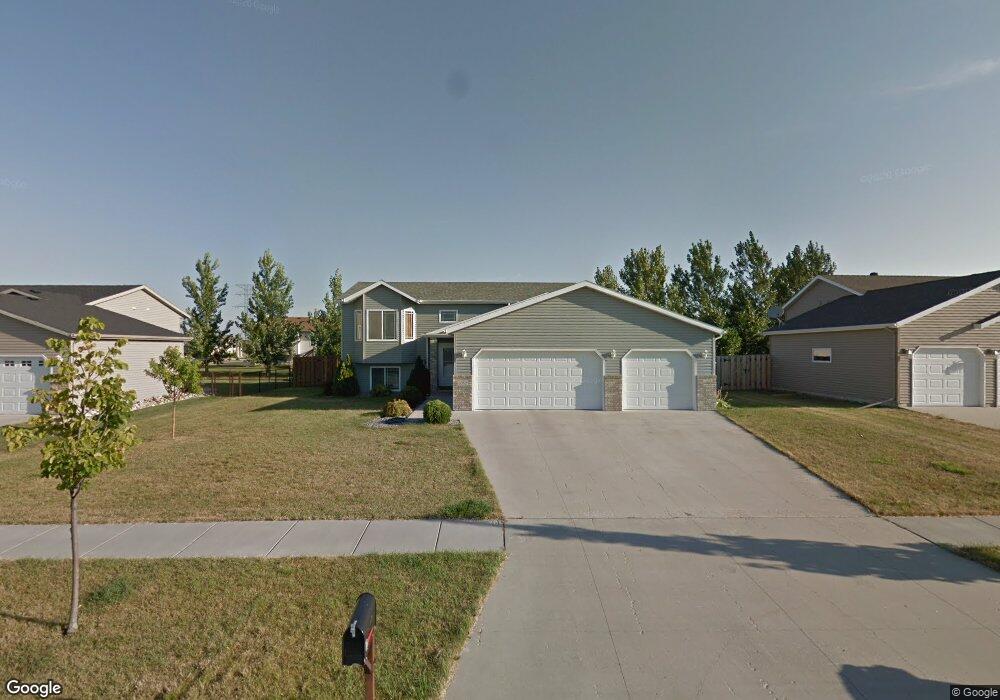
4369 35th Ave S Fargo, ND 58104
Pointe West NeighborhoodEstimated Value: $351,351 - $403,000
4
Beds
2
Baths
2,107
Sq Ft
$182/Sq Ft
Est. Value
About This Home
This home is located at 4369 35th Ave S, Fargo, ND 58104 and is currently estimated at $382,588, approximately $181 per square foot. 4369 35th Ave S is a home located in Cass County with nearby schools including Kennedy Elementary School, Discovery Middle School, and Fargo Davies High School.
Ownership History
Date
Name
Owned For
Owner Type
Purchase Details
Closed on
Mar 9, 2015
Sold by
Christ Jeffrey B and Crist Nicole M
Bought by
Schiefelbein Gregory and Schiefelbein Hannah
Current Estimated Value
Home Financials for this Owner
Home Financials are based on the most recent Mortgage that was taken out on this home.
Original Mortgage
$228,855
Outstanding Balance
$174,500
Interest Rate
3.56%
Mortgage Type
New Conventional
Estimated Equity
$208,088
Purchase Details
Closed on
May 19, 2006
Sold by
Brad Paul Enterprises Inc
Bought by
Crist Jeffrey B and Crist Nicole M
Home Financials for this Owner
Home Financials are based on the most recent Mortgage that was taken out on this home.
Original Mortgage
$148,750
Interest Rate
5.62%
Mortgage Type
FHA
Purchase Details
Closed on
May 18, 2006
Sold by
Matrix Properties Corp
Bought by
Brad Paul Enterprises Inc
Home Financials for this Owner
Home Financials are based on the most recent Mortgage that was taken out on this home.
Original Mortgage
$148,750
Interest Rate
5.62%
Mortgage Type
FHA
Create a Home Valuation Report for This Property
The Home Valuation Report is an in-depth analysis detailing your home's value as well as a comparison with similar homes in the area
Home Values in the Area
Average Home Value in this Area
Purchase History
| Date | Buyer | Sale Price | Title Company |
|---|---|---|---|
| Schiefelbein Gregory | -- | Title Co | |
| Crist Jeffrey B | $150,495 | -- | |
| Brad Paul Enterprises Inc | -- | -- |
Source: Public Records
Mortgage History
| Date | Status | Borrower | Loan Amount |
|---|---|---|---|
| Open | Schiefelbein Gregory | $228,855 | |
| Previous Owner | Crist Jeffrey B | $148,750 |
Source: Public Records
Tax History Compared to Growth
Tax History
| Year | Tax Paid | Tax Assessment Tax Assessment Total Assessment is a certain percentage of the fair market value that is determined by local assessors to be the total taxable value of land and additions on the property. | Land | Improvement |
|---|---|---|---|---|
| 2024 | $5,614 | $157,750 | $36,700 | $121,050 |
| 2023 | $6,250 | $164,400 | $38,300 | $126,100 |
| 2022 | $5,847 | $146,800 | $38,300 | $108,500 |
| 2021 | $5,518 | $136,550 | $38,300 | $98,250 |
| 2020 | $5,508 | $136,550 | $38,300 | $98,250 |
| 2019 | $5,496 | $136,550 | $23,950 | $112,600 |
| 2018 | $5,443 | $136,550 | $23,950 | $112,600 |
| 2017 | $5,198 | $124,150 | $23,950 | $100,200 |
| 2016 | $4,668 | $112,850 | $23,950 | $88,900 |
| 2015 | $4,989 | $112,850 | $16,300 | $96,550 |
| 2014 | $4,623 | $97,250 | $16,300 | $80,950 |
| 2013 | $4,416 | $90,900 | $16,300 | $74,600 |
Source: Public Records
Map
Nearby Homes
- 4216 34th Ave S
- 3606 Decorah Way S
- 3612 Decorah Way S
- 3624 Decorah Way
- 3630 Decorah Way S
- 4801 Decorah Way S
- 1665 3-Stall Plan at The Residence at Valley View Estates
- 4824 Decorah Way S
- 4849 Decorah Way S
- 4889 Chelsea Ln S
- 3166 Sienna Dr S
- 3712 49th St S
- 4306 39th Ave S
- 4293 39 1 2 Ave S
- 4318 39 1 2 Ave S
- 4276 39 1 2 Ave S
- 4274 39 1 2 Ave S
- 4245 Coventry Dr S
- 2812 Umber Ct S
- 4758 Townsite Place S
- 4359 35th Ave S
- 4379 35th Ave S
- 4378 34th Ave S
- 4378 34th Ave S
- 4368 34th Ave S
- 4388 34th Ave S
- 4349 35th Ave S
- 4388 34th Ave S
- 3505 Buchanan St S
- 4389 35th Ave S
- 3502 Lincoln St S
- 4358 34th Ave S
- 4398 34th Ave S
- 4398 34th Ave S
- 4337 35th Ave S
- 3523 Buchanan St S
- 4348 34th Ave S
- 4397 35th Ave S
- 3504 Buchanan St S
- 3393 Jackson St S