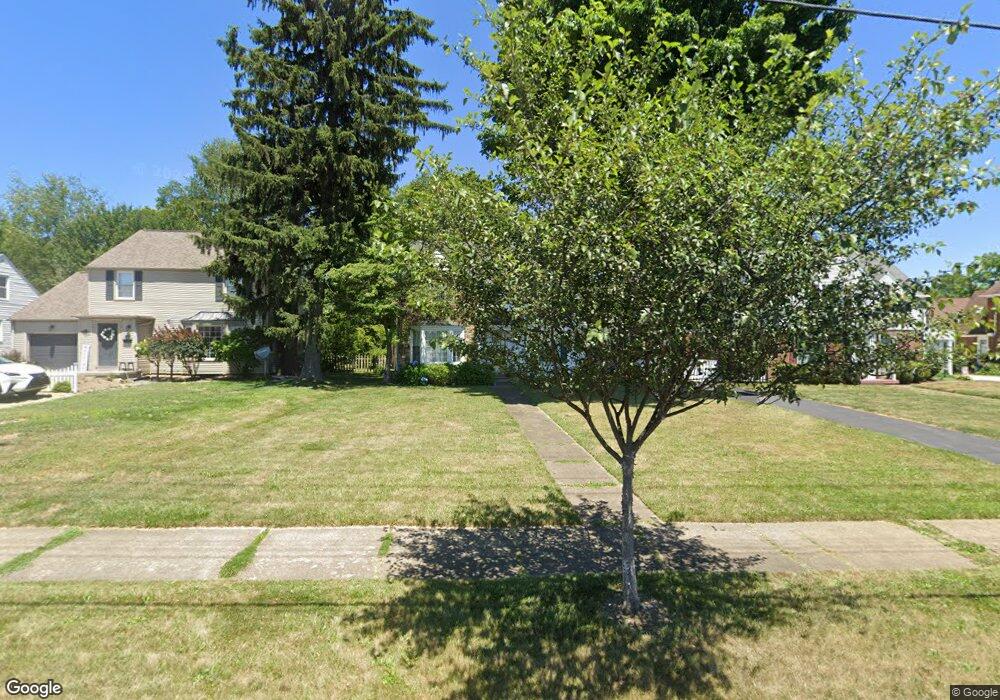
437 30th St NW Canton, OH 44709
Market Heights NeighborhoodEstimated Value: $191,000 - $237,810
4
Beds
2
Baths
1,940
Sq Ft
$110/Sq Ft
Est. Value
About This Home
This home is located at 437 30th St NW, Canton, OH 44709 and is currently estimated at $213,203, approximately $109 per square foot. 437 30th St NW is a home located in Stark County with nearby schools including Worley Elementary School, Early Learning Center @ Schreiber, and McKinley High School.
Ownership History
Date
Name
Owned For
Owner Type
Purchase Details
Closed on
Oct 30, 2012
Sold by
Rudell Mary F
Bought by
Chapman Martin A and Chapman Carol A
Current Estimated Value
Purchase Details
Closed on
Oct 26, 2012
Sold by
Chapman Martin A and Chapman Carol A
Bought by
Rudell Tim P and Rudell Mary F
Purchase Details
Closed on
Nov 3, 2011
Sold by
Fannie Mae
Bought by
Chapman Martin A and Chapman Carol A
Purchase Details
Closed on
Nov 22, 2010
Sold by
Marchand Nicholas J
Bought by
Federal National Mortgage Association
Purchase Details
Closed on
Mar 8, 2007
Sold by
Terry Robert P and Terry Kathleen
Bought by
Marchand Nicholas J and Marchand Tara R
Home Financials for this Owner
Home Financials are based on the most recent Mortgage that was taken out on this home.
Original Mortgage
$128,000
Interest Rate
6.28%
Mortgage Type
Purchase Money Mortgage
Purchase Details
Closed on
May 6, 1996
Sold by
Gelm William J
Bought by
Terry Robert P and Manning Kathleen
Home Financials for this Owner
Home Financials are based on the most recent Mortgage that was taken out on this home.
Original Mortgage
$77,200
Interest Rate
7.86%
Mortgage Type
New Conventional
Purchase Details
Closed on
Jun 3, 1993
Purchase Details
Closed on
Jul 24, 1989
Create a Home Valuation Report for This Property
The Home Valuation Report is an in-depth analysis detailing your home's value as well as a comparison with similar homes in the area
Home Values in the Area
Average Home Value in this Area
Purchase History
| Date | Buyer | Sale Price | Title Company |
|---|---|---|---|
| Chapman Martin A | $9,376,680 | None Available | |
| Rudell Tim P | $66,000 | None Available | |
| Chapman Martin A | $66,000 | None Available | |
| Federal National Mortgage Association | $84,000 | None Available | |
| Marchand Nicholas J | $128,000 | None Available | |
| Terry Robert P | $96,500 | -- | |
| -- | -- | -- | |
| -- | $64,500 | -- |
Source: Public Records
Mortgage History
| Date | Status | Borrower | Loan Amount |
|---|---|---|---|
| Previous Owner | Marchand Nicholas J | $128,000 | |
| Previous Owner | Terry Robert P | $77,200 |
Source: Public Records
Tax History
| Year | Tax Paid | Tax Assessment Tax Assessment Total Assessment is a certain percentage of the fair market value that is determined by local assessors to be the total taxable value of land and additions on the property. | Land | Improvement |
|---|---|---|---|---|
| 2025 | $1,200 | $63,350 | $11,690 | $51,660 |
| 2024 | -- | $63,350 | $11,690 | $51,660 |
| 2023 | $2,500 | $51,000 | $8,790 | $42,210 |
| 2022 | $1,225 | $51,000 | $8,790 | $42,210 |
| 2021 | $2,476 | $51,000 | $8,790 | $42,210 |
| 2020 | $2,384 | $45,160 | $7,810 | $37,350 |
| 2019 | $2,080 | $45,160 | $7,810 | $37,350 |
Source: Public Records
Map
Nearby Homes
- 709 29th St NE
- 329 37th St NW
- 910 Milford St NE
- 253 23rd St NW
- 839 37th St NW
- 1015 37th St NW
- 1202 37th St NW
- 3744 Edgefield Ave NW
- 1022 23rd St NW
- 1115 Colonial Blvd NE
- 2413 Cleveland Ave NW
- 1227 33rd St NE
- 3822 Edgefield Ave NW
- 1605 29th St NW
- 321 19th St NW
- 740 41st St NW
- 2745 Myrtle Ave NW
- 1415 26th St NW
- 1331 Spangler St NE
- 1307 22nd St NW
Your Personal Tour Guide
Ask me questions while you tour the home.