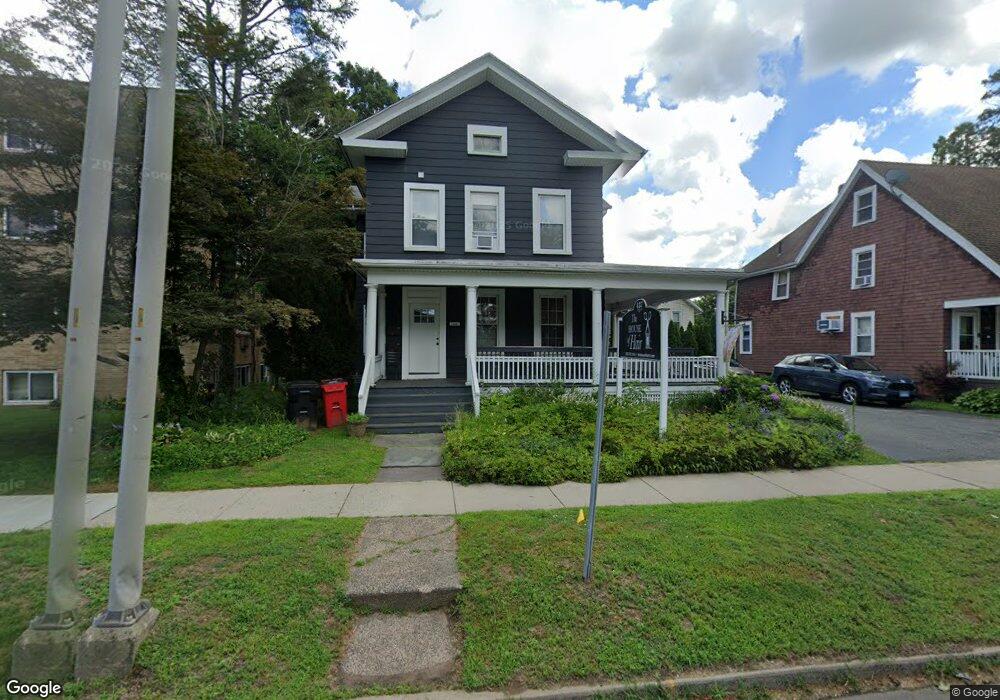
437 Broad St Meriden, CT 06450
Estimated Value: $134,000 - $171,000
1
Bed
1
Bath
968
Sq Ft
$152/Sq Ft
Est. Value
About This Home
This home is located at 437 Broad St, Meriden, CT 06450 and is currently estimated at $147,249, approximately $152 per square foot. 437 Broad St is a home located in New Haven County with nearby schools including Israel Putnam School, Washington Middle School, and Francis T. Maloney High School.
Ownership History
Date
Name
Owned For
Owner Type
Purchase Details
Closed on
Mar 4, 2022
Sold by
Sid Llc
Bought by
Miller Hope M
Current Estimated Value
Home Financials for this Owner
Home Financials are based on the most recent Mortgage that was taken out on this home.
Original Mortgage
$84,875
Outstanding Balance
$78,353
Interest Rate
3.69%
Mortgage Type
Purchase Money Mortgage
Estimated Equity
$68,896
Purchase Details
Closed on
Nov 20, 2021
Sold by
Danialan Lona
Bought by
Sid Llc
Purchase Details
Closed on
Jul 7, 2014
Sold by
Roth Barbara T Est and Wertheim-Wentheim
Bought by
Danialan Lona
Create a Home Valuation Report for This Property
The Home Valuation Report is an in-depth analysis detailing your home's value as well as a comparison with similar homes in the area
Home Values in the Area
Average Home Value in this Area
Purchase History
We collect this data history from publicly available records. To have your information removed, we recommend requesting removal directly through your county’s website.
| Date | Buyer | Sale Price | Title Company |
|---|---|---|---|
| Miller Hope M | $87,500 | None Available | |
| Sid Llc | $70,000 | None Available | |
| Danialan Lona | $31,500 | -- |
Source: Public Records
Mortgage History
We collect this data history from publicly available records. To have your information removed, we recommend requesting removal directly through your county’s website.
| Date | Status | Borrower | Loan Amount |
|---|---|---|---|
| Open | Miller Hope M | $84,875 |
Source: Public Records
Tax History
| Year | Tax Paid | Tax Assessment Tax Assessment Total Assessment is a certain percentage of the fair market value that is determined by local assessors to be the total taxable value of land and additions on the property. | Land | Improvement |
|---|---|---|---|---|
| 2025 | $1,942 | $48,440 | $0 | $48,440 |
| 2024 | $1,759 | $48,440 | $0 | $48,440 |
| 2023 | $1,685 | $48,440 | $0 | $48,440 |
| 2022 | $1,598 | $48,440 | $0 | $48,440 |
| 2021 | $1,339 | $32,760 | $0 | $32,760 |
| 2020 | $1,339 | $32,760 | $0 | $32,760 |
| 2019 | $1,339 | $32,760 | $0 | $32,760 |
| 2018 | $1,344 | $32,760 | $0 | $32,760 |
| 2017 | $1,308 | $32,760 | $0 | $32,760 |
| 2016 | $2,010 | $54,880 | $0 | $54,880 |
| 2015 | $2,010 | $54,880 | $0 | $54,880 |
| 2014 | $1,961 | $54,880 | $0 | $54,880 |
Source: Public Records
Map
Nearby Homes
- 275 Broad St Unit 9
- 23 Woodley Ct Unit 2
- 126 Willow St
- 223 Broad St
- 56 Twiss St
- 121 Willow St
- 38 Grant St
- 128 Hobart St
- 132 Carpenter Ave
- 144 View St
- 80 Pearl St
- 147 View St
- 151 View St
- 733 Broad St
- 15 South Ct
- 43 N Pearl St
- 192 Dexter Ave
- 7 Linden Place
- 153 Sterling Village Unit 153
- 33 W Main St Unit 24
Your Personal Tour Guide
Ask me questions while you tour the home.