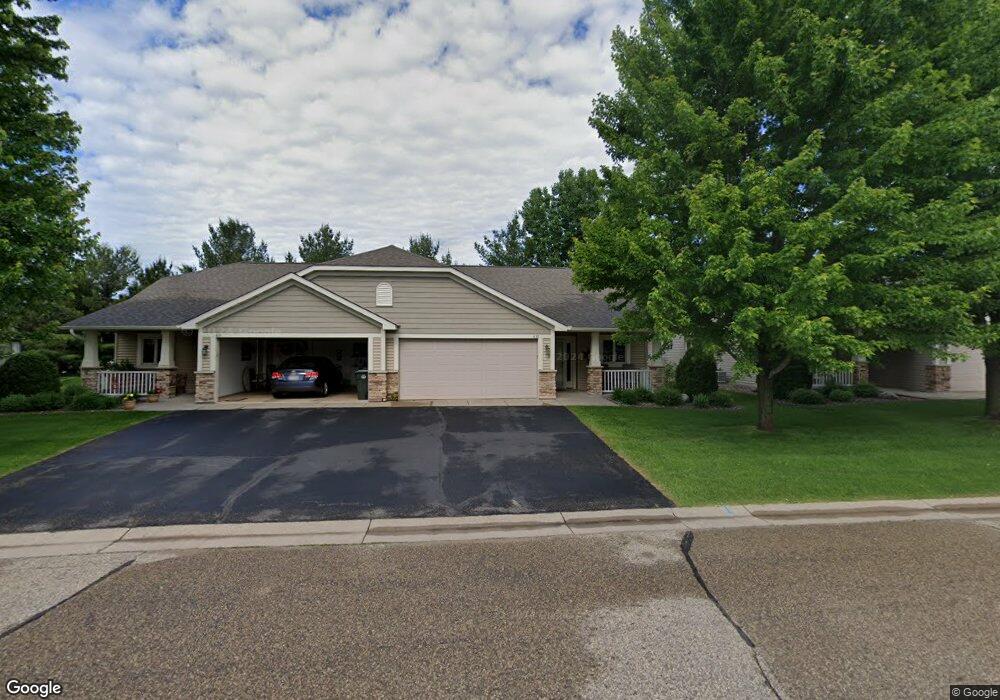
437 Cassandra Dr Unit 26 New Richmond, WI 54017
Estimated Value: $280,000 - $302,506
2
Beds
2
Baths
1,384
Sq Ft
$213/Sq Ft
Est. Value
About This Home
This home is located at 437 Cassandra Dr Unit 26, New Richmond, WI 54017 and is currently estimated at $294,127, approximately $212 per square foot. 437 Cassandra Dr Unit 26 is a home located in St. Croix County with nearby schools including New Richmond High School and St. Mary School.
Ownership History
Date
Name
Owned For
Owner Type
Purchase Details
Closed on
Jul 25, 2024
Sold by
Krueger Thomas L
Bought by
Thomas L Krueger Revocable Trust and Krueger
Current Estimated Value
Purchase Details
Closed on
Jan 16, 2023
Sold by
Luehman Dennis
Bought by
Krueger Thomas
Purchase Details
Closed on
Jul 15, 2014
Sold by
Bierbrauer Shannon E and Bierbrauer Kurtis
Bought by
Krueger Thomas and Luehman Dennis
Purchase Details
Closed on
Mar 15, 2012
Sold by
Derrick Homes Llc
Bought by
Beestman Shannon E
Home Financials for this Owner
Home Financials are based on the most recent Mortgage that was taken out on this home.
Original Mortgage
$128,250
Interest Rate
3.86%
Mortgage Type
New Conventional
Purchase Details
Closed on
Oct 27, 2006
Sold by
Derrick Development Lp
Bought by
Derrick Homes Llc
Create a Home Valuation Report for This Property
The Home Valuation Report is an in-depth analysis detailing your home's value as well as a comparison with similar homes in the area
Home Values in the Area
Average Home Value in this Area
Purchase History
| Date | Buyer | Sale Price | Title Company |
|---|---|---|---|
| Thomas L Krueger Revocable Trust | -- | None Listed On Document | |
| Krueger Thomas | $120,000 | -- | |
| Krueger Thomas | $149,900 | St Croix County Abstract & T | |
| Beestman Shannon E | $135,000 | St Croix County Abstract & T | |
| Derrick Homes Llc | $50,000 | None Available |
Source: Public Records
Mortgage History
| Date | Status | Borrower | Loan Amount |
|---|---|---|---|
| Previous Owner | Beestman Shannon E | $128,250 |
Source: Public Records
Tax History Compared to Growth
Tax History
| Year | Tax Paid | Tax Assessment Tax Assessment Total Assessment is a certain percentage of the fair market value that is determined by local assessors to be the total taxable value of land and additions on the property. | Land | Improvement |
|---|---|---|---|---|
| 2024 | $40 | $268,100 | $15,000 | $253,100 |
| 2023 | $3,552 | $242,000 | $15,000 | $227,000 |
| 2022 | $3,467 | $246,800 | $15,000 | $231,800 |
| 2021 | $3,262 | $220,000 | $15,000 | $205,000 |
| 2020 | $3,340 | $136,700 | $15,000 | $121,700 |
| 2019 | $3,166 | $136,700 | $15,000 | $121,700 |
| 2018 | $3,163 | $136,700 | $15,000 | $121,700 |
| 2017 | $3,050 | $136,700 | $15,000 | $121,700 |
| 2016 | $3,050 | $136,700 | $15,000 | $121,700 |
| 2015 | $3,089 | $136,700 | $15,000 | $121,700 |
| 2014 | $3,021 | $136,700 | $15,000 | $121,700 |
| 2013 | $2,960 | $136,700 | $15,000 | $121,700 |
Source: Public Records
Map
Nearby Homes
- 524 Cassandra Dr Unit 44
- 572 Williamsburg Place
- 444 Paperjack Dr
- 1575 Evan Ct
- 425 Paperjack Dr
- 1530 Hallewood Blvd
- 1600 Hallewood Blvd
- 1404 Bilmar Ave
- 1376 Valley Creek Dr
- 1208 Tierney Dr
- 1267 Naser Way
- 1131 Alfred Place
- 1171 Wisteria Ln
- 1185 (Lot 2) Wisteria Ln
- 1187 Wisteria Ln
- 1186 Wisteria Ln
- 1202 Poppy Ct
- 1364 Falcon Place
- 1310 Rose St
- 1338 Orchid Way
- 423 Cassandra Dr Unit 28
- 436 Cassandra Dr Unit 40
- 513 Cassandra Dr Unit 59
- 515 Cassandra Dr Unit 58
- 521 Cassandra Dr Unit 57
- 523 Cassandra Dr Unit 56
- 435 Cassandra Dr Unit 27
- 443 Cassandra Dr Unit 25
- 445 Cassandra Dr Unit 24
- 453 Cassandra Dr Unit 23
- 455 Cassandra Dr Unit 22
- 1563 Crestmoor Dr Unit 21
- 1561 Crestmoor Dr Unit 20
- 1557 Crestmoor Dr Unit 19
- 1543 Crestmoor Dr Unit 17
- 1541 Crestmoor Dr Unit 16
- 542 Cassandra Dr Unit 48
- 526 Cassandra Dr Unit 45
- 538 Cassandra Dr
- 540 Cassandra Dr