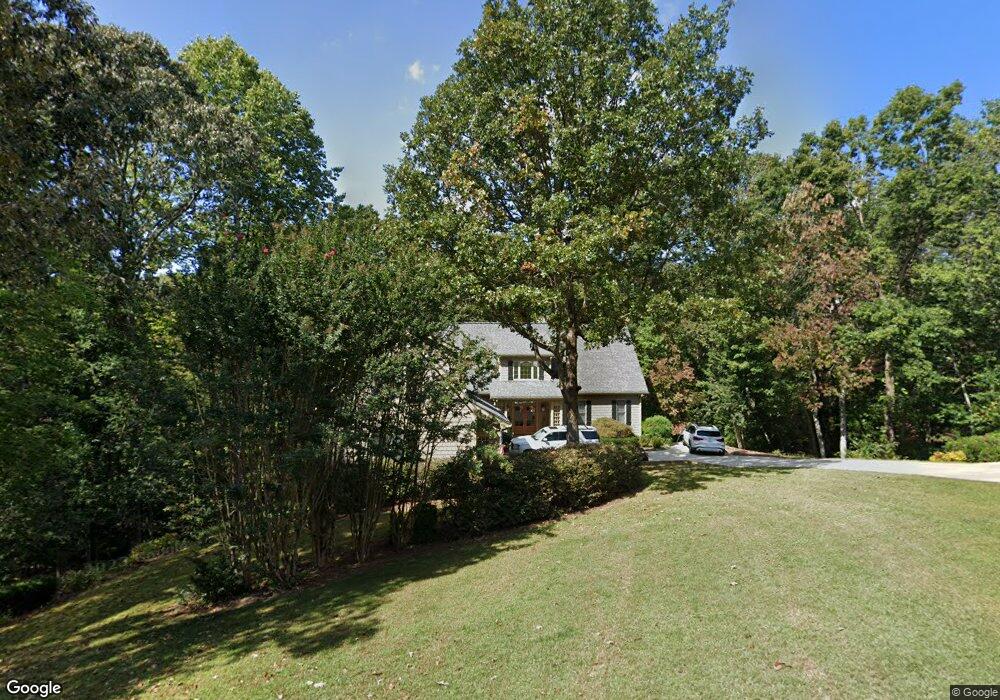
437 Cedar Run Dahlonega, GA 30533
Estimated Value: $496,615 - $766,000
--
Bed
3
Baths
2,592
Sq Ft
$243/Sq Ft
Est. Value
About This Home
This home is located at 437 Cedar Run, Dahlonega, GA 30533 and is currently estimated at $628,904, approximately $242 per square foot. 437 Cedar Run is a home located in Lumpkin County with nearby schools including Clay County Middle School and Lumpkin County High School.
Ownership History
Date
Name
Owned For
Owner Type
Purchase Details
Closed on
Jul 17, 2012
Sold by
Tufts Jack E and Tufts Carol A
Bought by
Carol A Tufts As Trustee Of The Tufts
Current Estimated Value
Home Financials for this Owner
Home Financials are based on the most recent Mortgage that was taken out on this home.
Original Mortgage
$161,500
Outstanding Balance
$24,830
Interest Rate
3.68%
Mortgage Type
New Conventional
Estimated Equity
$604,074
Purchase Details
Closed on
May 8, 2009
Sold by
Tufts Carol A
Bought by
Tufts Jack E
Home Financials for this Owner
Home Financials are based on the most recent Mortgage that was taken out on this home.
Original Mortgage
$187,200
Interest Rate
4.89%
Mortgage Type
New Conventional
Purchase Details
Closed on
Jan 26, 2007
Sold by
Not Provided
Bought by
Tufts Carol A
Purchase Details
Closed on
Jul 12, 2000
Sold by
Robinson Hoyt
Bought by
Tufts Jack E Carol A
Create a Home Valuation Report for This Property
The Home Valuation Report is an in-depth analysis detailing your home's value as well as a comparison with similar homes in the area
Home Values in the Area
Average Home Value in this Area
Purchase History
| Date | Buyer | Sale Price | Title Company |
|---|---|---|---|
| Carol A Tufts As Trustee Of The Tufts | -- | -- | |
| Tufts Jack E | -- | -- | |
| Tufts Carol A | -- | -- | |
| Tufts Carol A | -- | -- | |
| Tufts Jack E Carol A | $25,000 | -- |
Source: Public Records
Mortgage History
| Date | Status | Borrower | Loan Amount |
|---|---|---|---|
| Open | Carol A Tufts As Trustee Of The Tufts | $161,500 | |
| Previous Owner | Tufts Carol A | $187,200 |
Source: Public Records
Tax History Compared to Growth
Tax History
| Year | Tax Paid | Tax Assessment Tax Assessment Total Assessment is a certain percentage of the fair market value that is determined by local assessors to be the total taxable value of land and additions on the property. | Land | Improvement |
|---|---|---|---|---|
| 2024 | $1,470 | $177,980 | $20,228 | $157,752 |
| 2023 | $860 | $159,641 | $18,389 | $141,252 |
| 2022 | $1,063 | $146,605 | $15,323 | $131,282 |
| 2021 | $604 | $128,070 | $15,323 | $112,747 |
| 2020 | $467 | $113,729 | $14,683 | $99,046 |
| 2019 | $480 | $113,729 | $14,683 | $99,046 |
| 2018 | $375 | $100,463 | $14,683 | $85,780 |
| 2017 | $353 | $97,168 | $14,683 | $82,485 |
| 2016 | $247 | $86,899 | $14,683 | $72,216 |
| 2015 | $189 | $86,899 | $14,683 | $72,216 |
| 2014 | $189 | $87,706 | $14,683 | $73,023 |
| 2013 | -- | $88,513 | $14,682 | $73,830 |
Source: Public Records
Map
Nearby Homes
- 72 Rustin Ridge Unit 276
- 58 Rustin Ridge Unit 278
- 42 Rustin Ridge Unit 285
- 1376 Robinson Rd
- 2041 Long Branch Rd
- 2041 Long Branch Rd Unit TRACT 2A
- 0 Gold Crest Dr Unit 7623108
- 0 Gold Crest Dr Unit 10373986
- 38 Cavender Run
- 201 Perkins Rd
- 205 Perkins Rd
- 134 Prospector Ridge
- 0 Stamp Mill Dr
- 133 Stamp Mill Dr
- 245 Perkins Rd
- 270 Prospector Ridge
- 176 Stamp Mill Ln
- 533 Birch River Dr Unit GV17
- 67 Quartz Way
- 134 Rockhound Dr
- 415 Cedar Run
- 363 Chestnut Ridge Dr
- 0 Cedar Springs Ln Unit LOT 16
- 0 Cedar Springs Ln Unit LOT 20
- 0 Cedar Springs Ln Unit LOT 17
- 0 Cedar Springs Ln Unit 8880042
- 0 Cedar Springs Ln Unit 3175282
- 0 Cedar Springs Ln Unit 3193861
- 0 Cedar Springs Ln Unit 7476357
- 0 Cedar Springs Ln Unit 7542195
- 0 Cedar Springs Ln Unit 8098017
- 0 Cedar Springs Ln Unit 8413784
- 0 Cedar Springs Ln Unit 8488556
- 498 Robinson Ridge
- 445 Chestnut Ridge Dr
- 1500 Robinson Rd
- 438 Chestnut Ridge Dr
- 568 Robinson Ridge
- 355 Cedar Run
- 1547 Robinson Rd