Estimated Value: $370,653 - $544,000
3
Beds
2
Baths
2,198
Sq Ft
$195/Sq Ft
Est. Value
About This Home
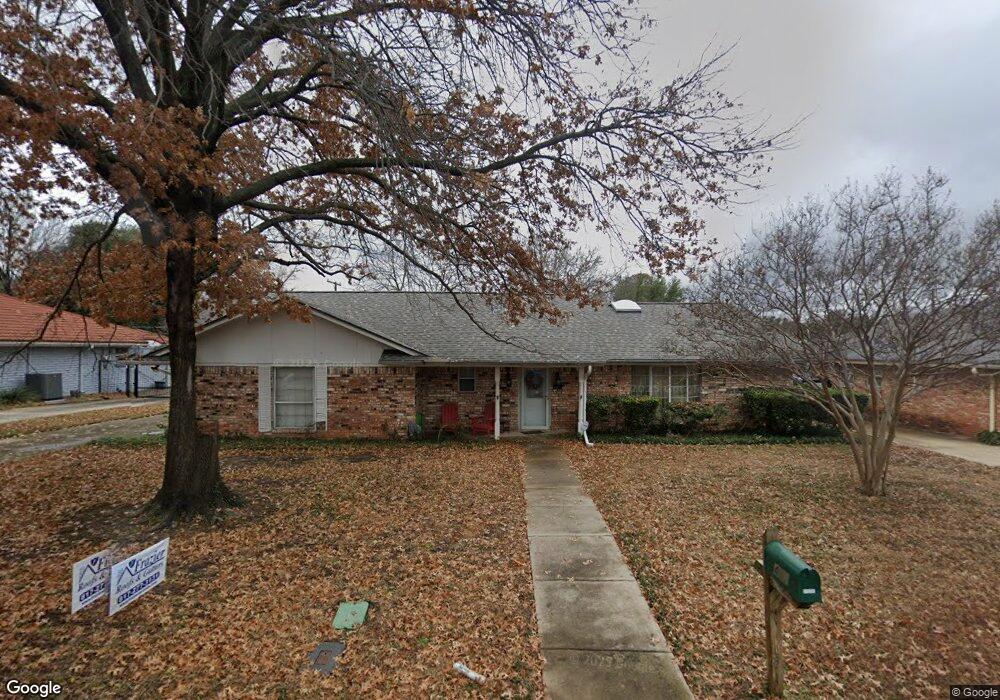
This home is located at 437 Circleview Dr S, Hurst, TX 76054 and is currently estimated at $427,663, approximately $194 per square foot. 437 Circleview Dr S is a home located in Tarrant County with nearby schools including Shady Oaks Elementary School, Bedford Junior High School, and L.D. Bell High School.
Ownership History
Date
Name
Owned For
Owner Type
Purchase Details
Closed on
Feb 23, 2016
Sold by
Discoe Michael L
Bought by
Discoe Michael L and Discoe Peggy J
Current Estimated Value
Home Financials for this Owner
Home Financials are based on the most recent Mortgage that was taken out on this home.
Original Mortgage
$348,000
Outstanding Balance
$276,152
Interest Rate
3.81%
Mortgage Type
Reverse Mortgage Home Equity Conversion Mortgage
Estimated Equity
$151,511
Purchase Details
Closed on
May 14, 2007
Sold by
Fly Scott E and Fly Erin E
Bought by
Discoe Michael L
Home Financials for this Owner
Home Financials are based on the most recent Mortgage that was taken out on this home.
Original Mortgage
$169,450
Interest Rate
6.13%
Mortgage Type
Purchase Money Mortgage
Purchase Details
Closed on
Aug 1, 2005
Sold by
Malmstrom John L and Malmstrom Edna M
Bought by
Fly Scott E
Home Financials for this Owner
Home Financials are based on the most recent Mortgage that was taken out on this home.
Original Mortgage
$139,176
Interest Rate
7.87%
Mortgage Type
New Conventional
Create a Home Valuation Report for This Property
The Home Valuation Report is an in-depth analysis detailing your home's value as well as a comparison with similar homes in the area
Home Values in the Area
Average Home Value in this Area
Purchase History
| Date | Buyer | Sale Price | Title Company |
|---|---|---|---|
| Discoe Michael L | -- | Attorney | |
| Discoe Michael L | -- | None Available | |
| Fly Scott E | -- | First Land Title |
Source: Public Records
Mortgage History
| Date | Status | Borrower | Loan Amount |
|---|---|---|---|
| Open | Discoe Michael L | $348,000 | |
| Closed | Discoe Michael L | $169,450 | |
| Previous Owner | Fly Scott E | $139,176 |
Source: Public Records
Tax History
| Year | Tax Paid | Tax Assessment Tax Assessment Total Assessment is a certain percentage of the fair market value that is determined by local assessors to be the total taxable value of land and additions on the property. | Land | Improvement |
|---|---|---|---|---|
| 2025 | $1,369 | $285,715 | $80,000 | $205,715 |
| 2024 | $1,369 | $285,715 | $80,000 | $205,715 |
| 2023 | $1,439 | $291,598 | $55,000 | $236,598 |
| 2022 | $5,665 | $246,040 | $55,000 | $191,040 |
| 2021 | $5,527 | $229,181 | $55,000 | $174,181 |
| 2020 | $5,874 | $266,581 | $55,000 | $211,581 |
| 2019 | $5,432 | $274,158 | $55,000 | $219,158 |
| 2018 | $2,752 | $201,780 | $55,000 | $146,780 |
| 2017 | $4,642 | $228,492 | $40,000 | $188,492 |
| 2016 | $4,220 | $199,683 | $40,000 | $159,683 |
| 2015 | $3,517 | $151,600 | $17,000 | $134,600 |
| 2014 | $3,517 | $151,600 | $17,000 | $134,600 |
Source: Public Records
Map
Nearby Homes
- 413 Baker Dr
- 532 Plainview Dr
- 612 Circleview Dr S
- 600 Circleview Dr N
- 440 W Louella Dr
- 1428 Pamela St
- 1613 Green Tree Dr
- 1625 Oak Creek Dr
- 1913 Yucca Trail
- 201 Hillview Dr
- 1905 Cimarron Trail
- 201 W Louella Dr
- 404 Mountainview Dr
- 1352 Simpson Dr
- 421 Cavender Ct
- 1348 Norwood Dr
- 137 E Louella Dr
- 180 Oakhurst Dr
- 1236 Harrison Ln
- 823 W Harwood Rd
- 433 Circleview Dr S
- 441 Circleview Dr S
- 436 W Pleasantview Dr
- 432 W Pleasantview Dr
- 440 W Pleasantview Dr
- 429 Circleview Dr S
- 445 Circleview Dr S
- 445 Circleview Dr S
- 436 Circleview Dr S
- 432 Circleview Dr S
- 440 Circleview Dr S
- 444 W Pleasantview Dr
- 428 W Pleasantview Dr
- 428 Circleview Dr S
- 425 Circleview Dr S
- 444 Circleview Dr S
- 449 Circleview Dr S
- 448 W Pleasantview Dr
- 424 W Pleasantview Dr
- 437 W Pleasantview Dr
Your Personal Tour Guide
Ask me questions while you tour the home.