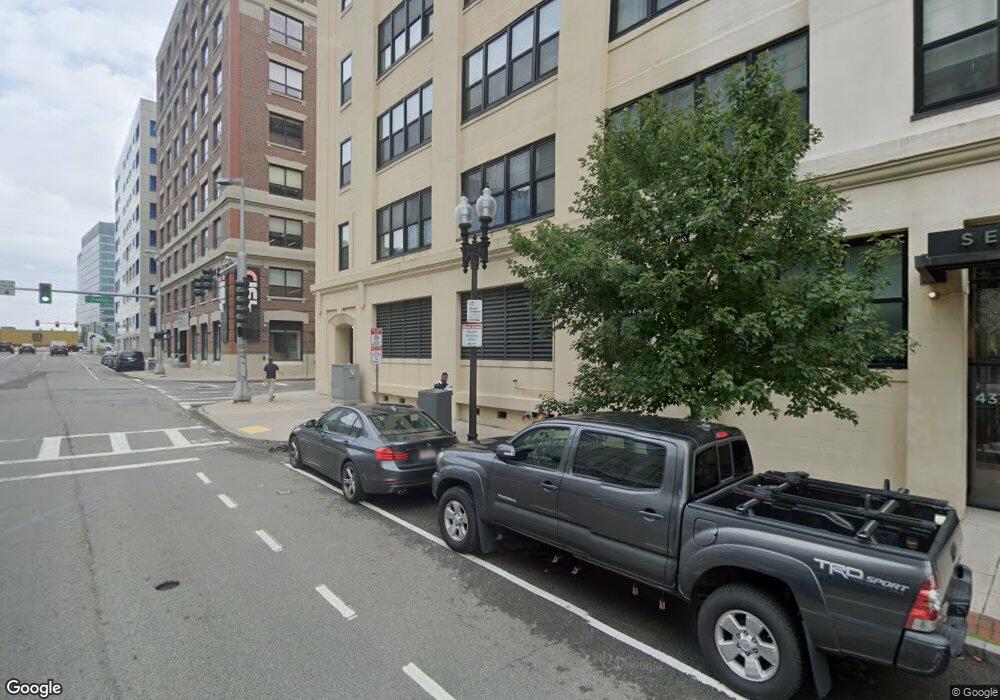
437 D St Unit 5A Boston, MA 02210
South Boston NeighborhoodEstimated Value: $1,194,000 - $1,362,000
Studio
1
Bath
1,500
Sq Ft
$854/Sq Ft
Est. Value
About This Home
This home is located at 437 D St Unit 5A, Boston, MA 02210 and is currently estimated at $1,280,318, approximately $853 per square foot. 437 D St Unit 5A is a home located in Suffolk County with nearby schools including Up Academy Charter School Of Boston, St Peter Academy, and Gate of Heaven Elementary School.
Ownership History
Date
Name
Owned For
Owner Type
Purchase Details
Closed on
Dec 30, 2016
Sold by
437 D5a Nt
Bought by
Isquith Jessica A
Current Estimated Value
Home Financials for this Owner
Home Financials are based on the most recent Mortgage that was taken out on this home.
Original Mortgage
$800,000
Outstanding Balance
$652,197
Interest Rate
3.75%
Mortgage Type
Unknown
Estimated Equity
$628,121
Purchase Details
Closed on
Dec 3, 2002
Sold by
Haven Timothy D
Bought by
437D-5A Nt and Marraghy Patrick B
Purchase Details
Closed on
Jun 24, 1997
Sold by
Lubin Stuart N
Bought by
Nadig Henry D and Nadig Lori B
Home Financials for this Owner
Home Financials are based on the most recent Mortgage that was taken out on this home.
Original Mortgage
$268,200
Interest Rate
7.87%
Mortgage Type
Purchase Money Mortgage
Purchase Details
Closed on
Dec 4, 1996
Sold by
437 D St Lp
Bought by
Lubin Stuart N
Create a Home Valuation Report for This Property
The Home Valuation Report is an in-depth analysis detailing your home's value as well as a comparison with similar homes in the area
Home Values in the Area
Average Home Value in this Area
Purchase History
| Date | Buyer | Sale Price | Title Company |
|---|---|---|---|
| Isquith Jessica A | $1,000,000 | -- | |
| 437D-5A Nt | $662,500 | -- | |
| Nadig Henry D | $298,000 | -- | |
| Lubin Stuart N | $188,000 | -- |
Source: Public Records
Mortgage History
| Date | Status | Borrower | Loan Amount |
|---|---|---|---|
| Open | Isquith Jessica A | $800,000 | |
| Previous Owner | Lubin Stuart N | $268,200 |
Source: Public Records
Tax History
| Year | Tax Paid | Tax Assessment Tax Assessment Total Assessment is a certain percentage of the fair market value that is determined by local assessors to be the total taxable value of land and additions on the property. | Land | Improvement |
|---|---|---|---|---|
| 2025 | $14,253 | $1,230,800 | $0 | $1,230,800 |
| 2024 | $12,979 | $1,190,700 | $0 | $1,190,700 |
| 2023 | $12,654 | $1,178,200 | $0 | $1,178,200 |
| 2022 | $12,572 | $1,155,500 | $0 | $1,155,500 |
| 2021 | $12,088 | $1,132,900 | $0 | $1,132,900 |
| 2020 | $11,130 | $1,054,000 | $0 | $1,054,000 |
| 2019 | $10,379 | $984,700 | $0 | $984,700 |
| 2018 | $10,320 | $984,700 | $0 | $984,700 |
| 2017 | $9,421 | $889,600 | $0 | $889,600 |
| 2016 | $8,770 | $797,300 | $0 | $797,300 |
| 2015 | $8,562 | $707,000 | $0 | $707,000 |
| 2014 | $8,024 | $637,800 | $0 | $637,800 |
Source: Public Records
Map
Nearby Homes
- 437 D St Unit 7F
- 437 D St Unit 3D
- 135 Seaport Blvd Unit 1618
- 135 Seaport Blvd Unit 1807
- 135 Seaport Blvd Unit 1508
- 135 Seaport Blvd Unit 2001
- 135 Seaport Blvd Unit 906
- 135 Seaport Blvd Unit 611
- 135 Seaport Blvd Unit 1708
- 135 Seaport Blvd Unit 2008
- 135 Seaport Blvd Unit 1806
- 135 Seaport Blvd Unit 1902
- 135 Seaport Blvd Unit 1503
- 135 Seaport Blvd Unit 1020
- 21 Wormwood St Unit 323
- 21 Wormwood St Unit 316-318
- 21 Wormwood St Unit 218
- 21 Wormwood St Unit 310
- 150 Seaport Blvd Unit 7D
- 150 Seaport Blvd Unit 6D
- 437 D St Unit 5F
- 437 D St Unit 5C
- 437 D St Unit 7G
- 437 D St Unit 7E
- 437 D St Unit 7C
- 437 D St Unit 7B
- 437 D St Unit 7A
- 437 D St Unit 6G
- 437 D St Unit 6F
- 437 D St Unit 6E
- 437 D St Unit 6D
- 437 D St Unit 6C
- 437 D St Unit 6B
- 437 D St Unit 6A
- 437 D St Unit 5E
- 437 D St Unit 5D
- 437 D St Unit 5B
- 437 D St Unit 4G
- 437 D St Unit 4F
- 437 D St Unit 4E
Your Personal Tour Guide
Ask me questions while you tour the home.