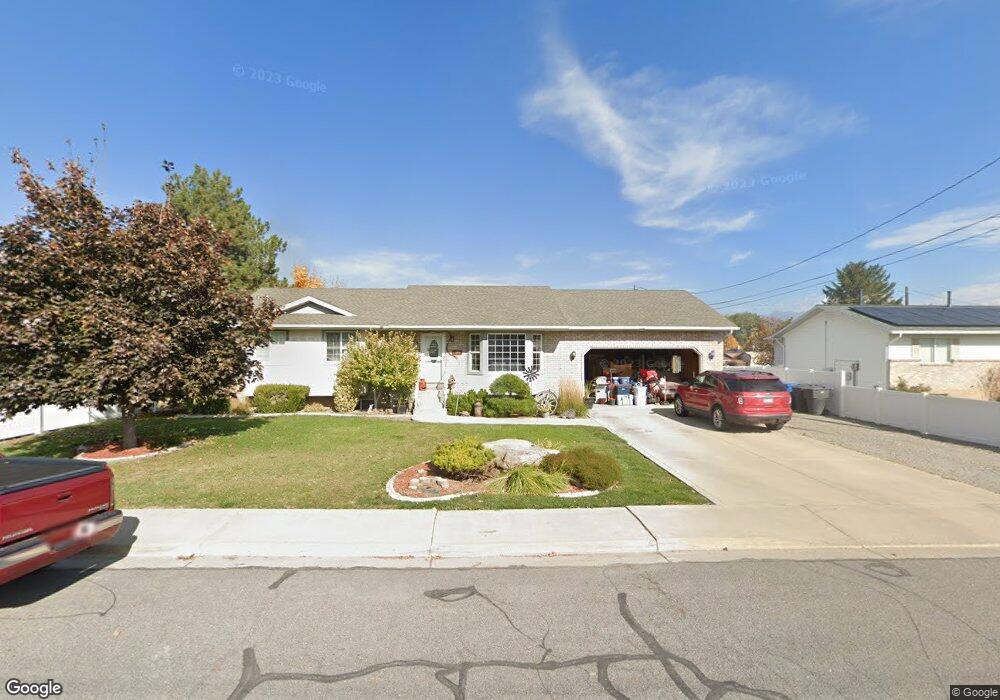
437 E 600 S Payson, UT 84651
Estimated Value: $435,000 - $508,000
3
Beds
2
Baths
1,364
Sq Ft
$348/Sq Ft
Est. Value
About This Home
This home is located at 437 E 600 S, Payson, UT 84651 and is currently estimated at $474,377, approximately $347 per square foot. 437 E 600 S is a home located in Utah County with nearby schools including Park View Elementary, Payson Junior High School, and Payson High School.
Ownership History
Date
Name
Owned For
Owner Type
Purchase Details
Closed on
Nov 17, 2006
Sold by
Smith N Wayne N and Smith Cheryl Ann
Bought by
Smith N W N and Smith Cheryl A
Current Estimated Value
Home Financials for this Owner
Home Financials are based on the most recent Mortgage that was taken out on this home.
Original Mortgage
$166,000
Outstanding Balance
$99,016
Interest Rate
6.36%
Mortgage Type
New Conventional
Estimated Equity
$375,361
Purchase Details
Closed on
Apr 1, 1998
Sold by
Walker Mike D
Bought by
Smith N Wayne N and Smith Cheryl Ann
Home Financials for this Owner
Home Financials are based on the most recent Mortgage that was taken out on this home.
Original Mortgage
$127,700
Interest Rate
7.18%
Purchase Details
Closed on
Jul 18, 1997
Sold by
Hathaway Blake A and Hathaway Katherine J
Bought by
Walker Mike D
Create a Home Valuation Report for This Property
The Home Valuation Report is an in-depth analysis detailing your home's value as well as a comparison with similar homes in the area
Home Values in the Area
Average Home Value in this Area
Purchase History
| Date | Buyer | Sale Price | Title Company |
|---|---|---|---|
| Smith N W N | -- | Backman | |
| Smith N Wayne N | -- | First American Title | |
| Walker Mike D | -- | First American |
Source: Public Records
Mortgage History
| Date | Status | Borrower | Loan Amount |
|---|---|---|---|
| Open | Smith N W N | $166,000 | |
| Closed | Smith N Wayne N | $127,700 |
Source: Public Records
Tax History
| Year | Tax Paid | Tax Assessment Tax Assessment Total Assessment is a certain percentage of the fair market value that is determined by local assessors to be the total taxable value of land and additions on the property. | Land | Improvement |
|---|---|---|---|---|
| 2025 | $2,193 | $244,750 | -- | -- |
| 2024 | $2,193 | $223,190 | $0 | $0 |
| 2023 | $2,198 | $224,345 | $0 | $0 |
| 2022 | $2,099 | $210,650 | $0 | $0 |
| 2021 | $1,739 | $280,000 | $85,600 | $194,400 |
| 2020 | $1,660 | $261,500 | $77,800 | $183,700 |
| 2019 | $1,554 | $250,900 | $67,200 | $183,700 |
| 2018 | $1,475 | $229,600 | $56,600 | $173,000 |
| 2017 | $1,346 | $112,695 | $0 | $0 |
| 2016 | $1,322 | $109,890 | $0 | $0 |
| 2015 | $1,259 | $103,950 | $0 | $0 |
| 2014 | $1,115 | $92,785 | $0 | $0 |
Source: Public Records
Map
Nearby Homes
Your Personal Tour Guide
Ask me questions while you tour the home.