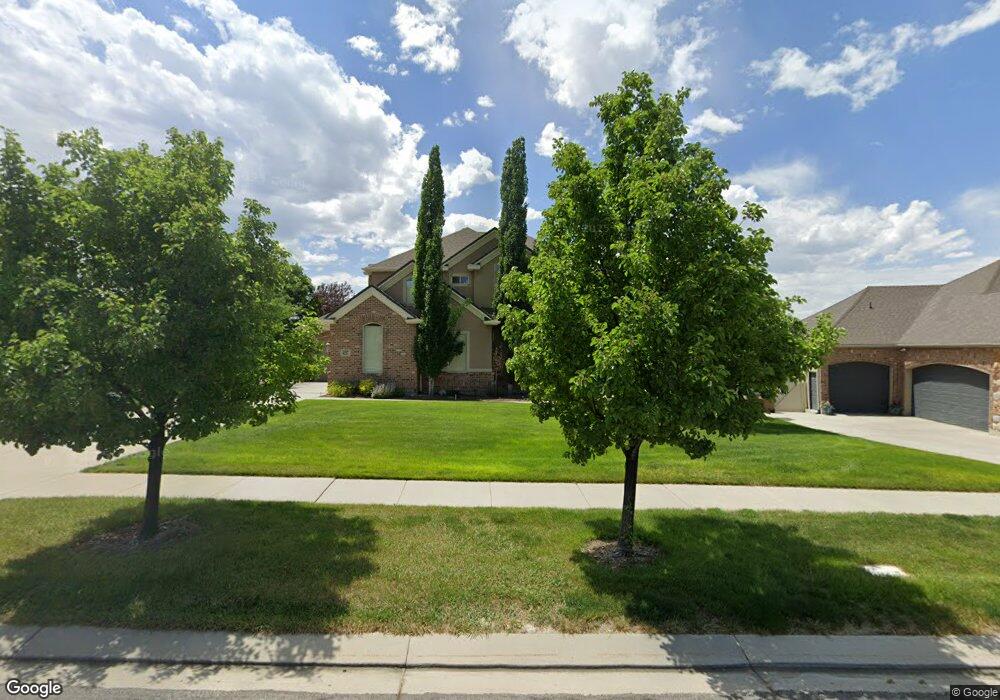
437 E Southfork Dr Draper, UT 84020
Estimated Value: $1,218,651 - $1,564,000
5
Beds
4
Baths
4,600
Sq Ft
$293/Sq Ft
Est. Value
About This Home
This home is located at 437 E Southfork Dr, Draper, UT 84020 and is currently estimated at $1,346,913, approximately $292 per square foot. 437 E Southfork Dr is a home located in Salt Lake County with nearby schools including Draper Elementary School, Corner Canyon High School, and Draper Park Middle School.
Ownership History
Date
Name
Owned For
Owner Type
Purchase Details
Closed on
Dec 31, 2007
Sold by
Eyre Trenton and Eyre Lorilee
Bought by
Smedley Judson M and Smedley Margaret
Current Estimated Value
Home Financials for this Owner
Home Financials are based on the most recent Mortgage that was taken out on this home.
Original Mortgage
$417,000
Interest Rate
5.78%
Mortgage Type
Purchase Money Mortgage
Purchase Details
Closed on
Aug 3, 2001
Sold by
Yates Cindy P
Bought by
Eyre Trenton and Eyre Lorilee
Purchase Details
Closed on
Mar 5, 2001
Sold by
K P Development Inc
Bought by
Yates Cindy P
Home Financials for this Owner
Home Financials are based on the most recent Mortgage that was taken out on this home.
Original Mortgage
$11,500
Interest Rate
7.12%
Mortgage Type
Seller Take Back
Create a Home Valuation Report for This Property
The Home Valuation Report is an in-depth analysis detailing your home's value as well as a comparison with similar homes in the area
Home Values in the Area
Average Home Value in this Area
Purchase History
| Date | Buyer | Sale Price | Title Company |
|---|---|---|---|
| Smedley Judson M | -- | First American Title | |
| Eyre Trenton | -- | Merrill Title | |
| Yates Cindy P | -- | -- |
Source: Public Records
Mortgage History
| Date | Status | Borrower | Loan Amount |
|---|---|---|---|
| Closed | Smedley Judson M | $417,000 | |
| Previous Owner | Yates Cindy P | $11,500 |
Source: Public Records
Tax History
| Year | Tax Paid | Tax Assessment Tax Assessment Total Assessment is a certain percentage of the fair market value that is determined by local assessors to be the total taxable value of land and additions on the property. | Land | Improvement |
|---|---|---|---|---|
| 2025 | $5,214 | $1,104,800 | $334,400 | $770,400 |
| 2024 | $5,214 | $996,100 | $314,500 | $681,600 |
| 2023 | $4,824 | $914,700 | $276,700 | $638,000 |
| 2022 | $4,916 | $900,300 | $271,200 | $629,100 |
| 2021 | $5,055 | $790,900 | $220,600 | $570,300 |
| 2020 | $4,876 | $723,200 | $181,700 | $541,500 |
| 2019 | $4,821 | $698,600 | $181,700 | $516,900 |
Source: Public Records
Map
Nearby Homes
- 13898 Summerset Cir
- 645 E Rocky Mouth Ln
- 13888 S Wheadon Ct
- 14374 S Champ Cove Unit 138
- 14383 S Champ Cove
- 14382 S Champ Cove
- 14388 S Champ Cove
- 14392 S Champ Cove
- 14396 S Champ Cove
- 455 E Rocky Mouth Ln
- 14412 S Champ Cove
- 14414 S Champ Cove
- 328 E Tri Ln
- 317 E Endurance Cir
- 311 E Endurance Cir
- 307 E Endurance Cir
- 301 E Endurance Cir
- 528 E 13710 S
- 248 E 13800 S Unit 27
- 624 Rocky Knoll Ln
- 437 Southfork Dr
- 437 Southfork Dr Unit 5
- 453 Southfork Dr
- 453 E Southfork Dr
- 477 Southfork Dr
- 14079 Fitzgerald Ct
- 14079 Fitzgerald Ct Unit 6
- 498 Southfork Dr
- 14079 S Fitzgerald Ct
- 14077 Fitzgerald Ct
- 14077 S Fitzgerald Ct
- 506 Southfork Dr
- 493 Southfork Dr
- 507 Hollow Creek Rd
- 507 E Hollow Creek Rd
- 14063 Fitzgerald Ct
- 502 Hollow Creek Rd
- 502 E Hollow Creek Rd
- 14074 Fitzgerald Ct
- 518 Southfork Dr
Your Personal Tour Guide
Ask me questions while you tour the home.