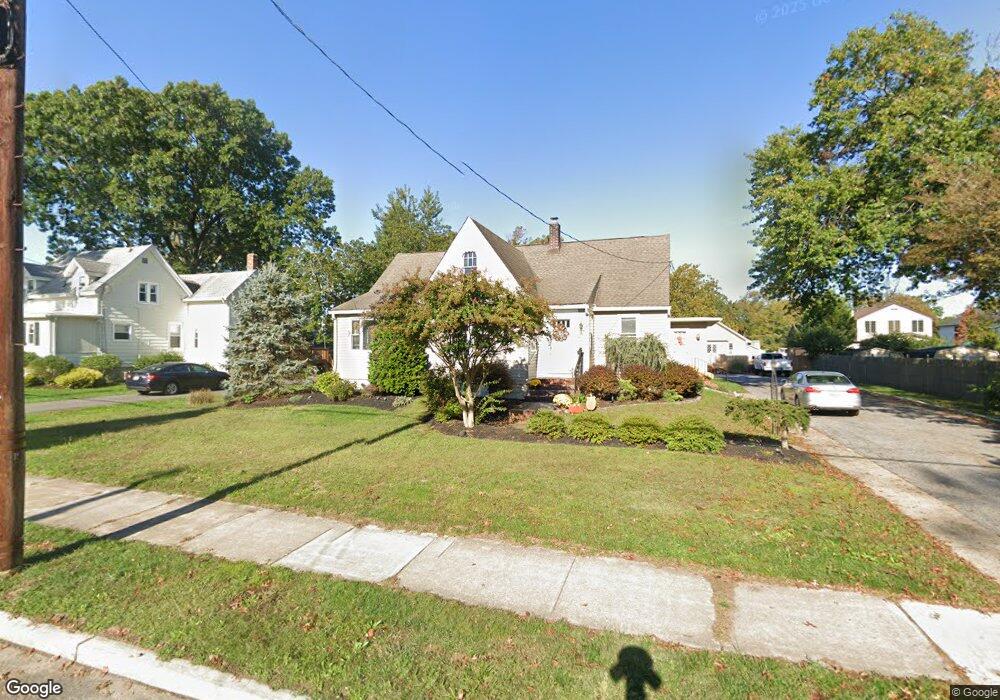
437 Grape St Hammonton, NJ 08037
Estimated Value: $391,968 - $460,000
3
Beds
2
Baths
2,256
Sq Ft
$185/Sq Ft
Est. Value
About This Home
This home is located at 437 Grape St, Hammonton, NJ 08037 and is currently estimated at $417,742, approximately $185 per square foot. 437 Grape St is a home located in Atlantic County with nearby schools including Hammonton Early Childhood Education Center, Warren E. Sooy Jr. Elementary School, and Hammonton Middle School.
Ownership History
Date
Name
Owned For
Owner Type
Purchase Details
Closed on
Apr 29, 2009
Sold by
Penza Kathleen
Bought by
Bagliani Lori
Current Estimated Value
Purchase Details
Closed on
Mar 3, 2008
Sold by
Bagliani Joseph and Bagliani Lori
Bought by
Penza Kathleen
Purchase Details
Closed on
Sep 17, 2003
Sold by
Penza Kathleen
Bought by
Bagliani Joseph and Bagliani Lori
Purchase Details
Closed on
Mar 3, 1995
Sold by
Cappuccio George and Cappuccio Emmanuel
Bought by
Cappuccio Emmanuel
Purchase Details
Closed on
Sep 15, 1992
Sold by
Renzi John J
Bought by
Penza Kathleen
Create a Home Valuation Report for This Property
The Home Valuation Report is an in-depth analysis detailing your home's value as well as a comparison with similar homes in the area
Home Values in the Area
Average Home Value in this Area
Purchase History
| Date | Buyer | Sale Price | Title Company |
|---|---|---|---|
| Bagliani Lori | -- | None Available | |
| Penza Kathleen | -- | None Available | |
| Bagliani Joseph | -- | -- | |
| Bagliani Joseph | -- | -- | |
| Cappuccio Emmanuel | -- | -- | |
| Cappuccio George | -- | -- | |
| Penza Kathleen | -- | -- |
Source: Public Records
Tax History
| Year | Tax Paid | Tax Assessment Tax Assessment Total Assessment is a certain percentage of the fair market value that is determined by local assessors to be the total taxable value of land and additions on the property. | Land | Improvement |
|---|---|---|---|---|
| 2025 | $5,859 | $212,900 | $57,500 | $155,400 |
| 2024 | $5,848 | $212,900 | $57,500 | $155,400 |
Source: Public Records
Map
Nearby Homes
Your Personal Tour Guide
Ask me questions while you tour the home.