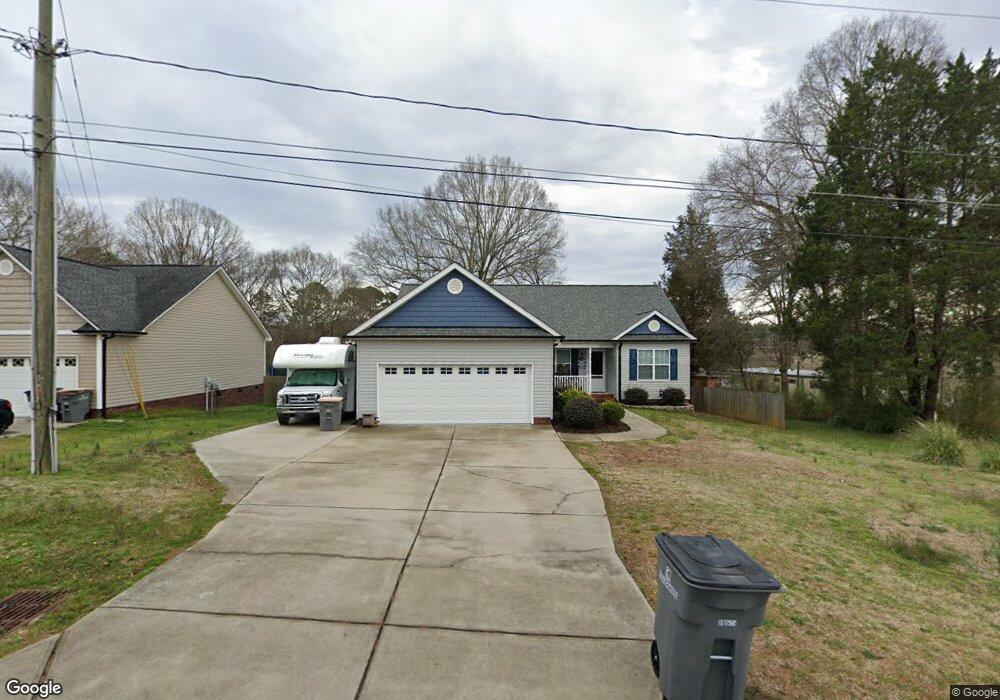
437 Highland St Concord, NC 28027
Estimated Value: $278,000 - $328,488
3
Beds
2
Baths
1,385
Sq Ft
$221/Sq Ft
Est. Value
About This Home
This home is located at 437 Highland St, Concord, NC 28027 and is currently estimated at $305,872, approximately $220 per square foot. 437 Highland St is a home located in Cabarrus County with nearby schools including Winecoff Elementary School, Northwest Cabarrus Middle School, and Northwest Cabarrus High.
Ownership History
Date
Name
Owned For
Owner Type
Purchase Details
Closed on
Sep 29, 2023
Sold by
Cook Judith Lynn and Cook Douglas Todd
Bought by
Judith Lynn Cook Living Trust and Cook
Current Estimated Value
Purchase Details
Closed on
Aug 22, 2008
Sold by
Jdl Homes Inc
Bought by
Powers Judith L
Home Financials for this Owner
Home Financials are based on the most recent Mortgage that was taken out on this home.
Original Mortgage
$107,500
Interest Rate
6.21%
Mortgage Type
Purchase Money Mortgage
Purchase Details
Closed on
Jan 15, 2008
Sold by
Laton Gary W and Laton Kristi S
Bought by
Jdl Homes Inc
Home Financials for this Owner
Home Financials are based on the most recent Mortgage that was taken out on this home.
Original Mortgage
$100,000
Interest Rate
5.94%
Mortgage Type
Construction
Create a Home Valuation Report for This Property
The Home Valuation Report is an in-depth analysis detailing your home's value as well as a comparison with similar homes in the area
Home Values in the Area
Average Home Value in this Area
Purchase History
| Date | Buyer | Sale Price | Title Company |
|---|---|---|---|
| Judith Lynn Cook Living Trust | -- | None Listed On Document | |
| Powers Judith L | $155,500 | None Available | |
| Jdl Homes Inc | $34,000 | None Available |
Source: Public Records
Mortgage History
| Date | Status | Borrower | Loan Amount |
|---|---|---|---|
| Previous Owner | Powers Judith L | $107,500 | |
| Previous Owner | Jdl Homes Inc | $100,000 |
Source: Public Records
Tax History
| Year | Tax Paid | Tax Assessment Tax Assessment Total Assessment is a certain percentage of the fair market value that is determined by local assessors to be the total taxable value of land and additions on the property. | Land | Improvement |
|---|---|---|---|---|
| 2025 | $2,672 | $323,420 | $50,000 | $273,420 |
| 2024 | $3,672 | $323,420 | $50,000 | $273,420 |
| 2023 | $2,507 | $183,010 | $28,000 | $155,010 |
| 2022 | $2,007 | $183,010 | $28,000 | $155,010 |
| 2021 | $2,007 | $183,010 | $28,000 | $155,010 |
| 2020 | $2,507 | $183,010 | $28,000 | $155,010 |
| 2019 | $2,008 | $146,600 | $17,000 | $129,600 |
| 2018 | $1,979 | $146,600 | $17,000 | $129,600 |
| 2017 | $1,950 | $146,600 | $17,000 | $129,600 |
| 2016 | $1,950 | $153,550 | $25,000 | $128,550 |
| 2015 | $1,837 | $145,820 | $25,000 | $120,820 |
| 2014 | $1,837 | $145,820 | $25,000 | $120,820 |
Source: Public Records
Map
Nearby Homes
- 626 Flicker St
- 615 Flicker St
- 624 Flicker St
- 121 Greenview Dr
- 2040 Kannapolis Hwy
- 2342 Bloomfield Dr
- 367 Courtland Ct
- 2448 Spruce St
- 2203 Oakhurst Ct
- 3000 Big Bend Dr
- 3020 Big Bend Dr
- 3050 Big Bend Dr
- 3060 Big Bend Dr
- 2475 Hedgecliff Rd
- 2485 Hedgecliff Rd
- 2515 Hedgecliff Rd
- 2525 Hedgecliff Rd
- 2535 Hedgecliff Rd
- 2545 Hedgecliff Rd
- 3115 Big Bend Dr
Your Personal Tour Guide
Ask me questions while you tour the home.