Estimated Value: $293,790 - $309,000
3
Beds
2
Baths
1,540
Sq Ft
$194/Sq Ft
Est. Value
About This Home
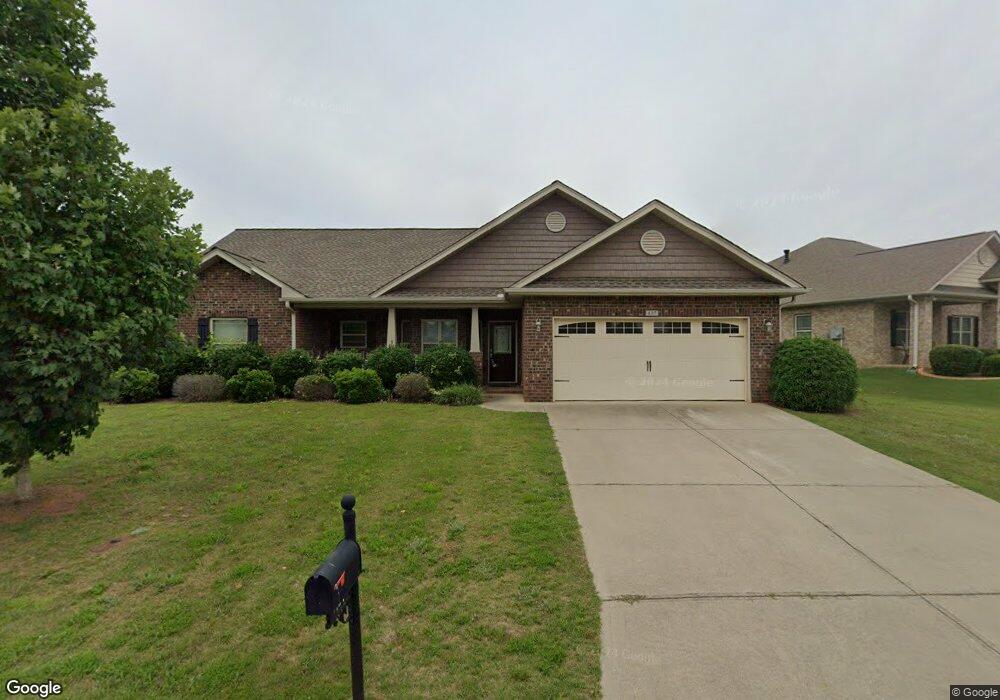
This home is located at 437 Jewelwood Dr Unit SLE 13, Lyman, SC 29365 and is currently estimated at $299,448, approximately $194 per square foot. 437 Jewelwood Dr Unit SLE 13 is a home located in Spartanburg County with nearby schools including Byrnes Freshman Academy, Beech Springs Middle School, and James F. Byrnes High School.
Ownership History
Date
Name
Owned For
Owner Type
Purchase Details
Closed on
Jul 23, 2024
Sold by
Sloan Drew D
Bought by
Webb Nickie Lyons
Current Estimated Value
Home Financials for this Owner
Home Financials are based on the most recent Mortgage that was taken out on this home.
Original Mortgage
$232,804
Outstanding Balance
$230,002
Interest Rate
6.95%
Mortgage Type
FHA
Estimated Equity
$69,446
Purchase Details
Closed on
Jul 10, 2017
Sold by
Sloan Brett Joe
Bought by
Sloan Drew D
Home Financials for this Owner
Home Financials are based on the most recent Mortgage that was taken out on this home.
Original Mortgage
$149,494
Interest Rate
3.95%
Mortgage Type
New Conventional
Purchase Details
Closed on
May 27, 2013
Sold by
Adams Homes Aec Llc
Bought by
Sloan Brett Joe
Home Financials for this Owner
Home Financials are based on the most recent Mortgage that was taken out on this home.
Original Mortgage
$154,081
Interest Rate
3.59%
Mortgage Type
New Conventional
Create a Home Valuation Report for This Property
The Home Valuation Report is an in-depth analysis detailing your home's value as well as a comparison with similar homes in the area
Home Values in the Area
Average Home Value in this Area
Purchase History
| Date | Buyer | Sale Price | Title Company |
|---|---|---|---|
| Webb Nickie Lyons | $286,000 | None Listed On Document | |
| Sloan Drew D | $148,000 | None Available | |
| Sloan Brett Joe | $151,000 | -- |
Source: Public Records
Mortgage History
| Date | Status | Borrower | Loan Amount |
|---|---|---|---|
| Open | Webb Nickie Lyons | $232,804 | |
| Previous Owner | Sloan Drew D | $149,494 | |
| Previous Owner | Sloan Brett Joe | $154,081 |
Source: Public Records
Tax History Compared to Growth
Tax History
| Year | Tax Paid | Tax Assessment Tax Assessment Total Assessment is a certain percentage of the fair market value that is determined by local assessors to be the total taxable value of land and additions on the property. | Land | Improvement |
|---|---|---|---|---|
| 2025 | $1,485 | $11,436 | $1,580 | $9,856 |
| 2024 | $1,485 | $6,850 | $1,077 | $5,773 |
| 2023 | $1,485 | $6,850 | $1,077 | $5,773 |
| 2022 | $1,302 | $5,956 | $1,000 | $4,956 |
| 2021 | $1,302 | $5,956 | $1,000 | $4,956 |
| 2020 | $1,283 | $5,956 | $1,000 | $4,956 |
| 2019 | $1,281 | $5,956 | $1,000 | $4,956 |
| 2018 | $1,238 | $5,956 | $1,000 | $4,956 |
| 2017 | $1,247 | $6,004 | $1,000 | $5,004 |
| 2016 | $1,217 | $6,004 | $1,000 | $5,004 |
| 2015 | $1,200 | $6,004 | $1,000 | $5,004 |
| 2014 | $1,204 | $6,004 | $1,000 | $5,004 |
Source: Public Records
Map
Nearby Homes
- 322 Hartleigh Dr
- 509 Friar Park Ln
- 461 Madison Creek Ct
- 264 Walcott Dr
- 248 Walcott Dr
- 0 W Greenville Hwy
- 1408 Apple Butter Dr
- 1404 Apple Butter Dr
- Marigold Plan at Stanford Village
- Iris Plan at Stanford Village
- Lily Plan at Stanford Village
- 1056 Westergard Way
- 1411 Apple Butter Dr
- 420 Fairbanks Ct
- 776 Spring Orchard Dr
- 658 Grover Dr
- 772 Spring Orchard Dr
- 150 Weisser Ln
- 1546 Honeybee Ln
- 308 Durango Trail
- 437 Jewelwood Dr
- 441 Jewelwood Dr Unit SLE lot 14
- 441 Jewelwood Dr
- 433 Jewelwood Dr Unit SLE 12
- 433 Jewelwood Dr
- 508 Goldenlarch Way Unit SLE11
- 508 Goldenlarch Way
- 434 Jewelwood Dr
- 607 Hedgeapple Ln Unit SLE 16
- 607 Hedgeapple Ln
- 445 Jewelwood Dr
- 430 Jewelwood Dr
- 442 Jewelwood Dr
- 438 Jewelwood Dr Unit SLE 30
- 438 Jewelwood Dr
- 427 Jewelwood Dr
- 446 Jewelwood Dr Unit Lyman SC 29365
- 446 Jewelwood Dr
- 512 Goldenlarch Way
- 611 Hedgeapple Ln Unit SLE17