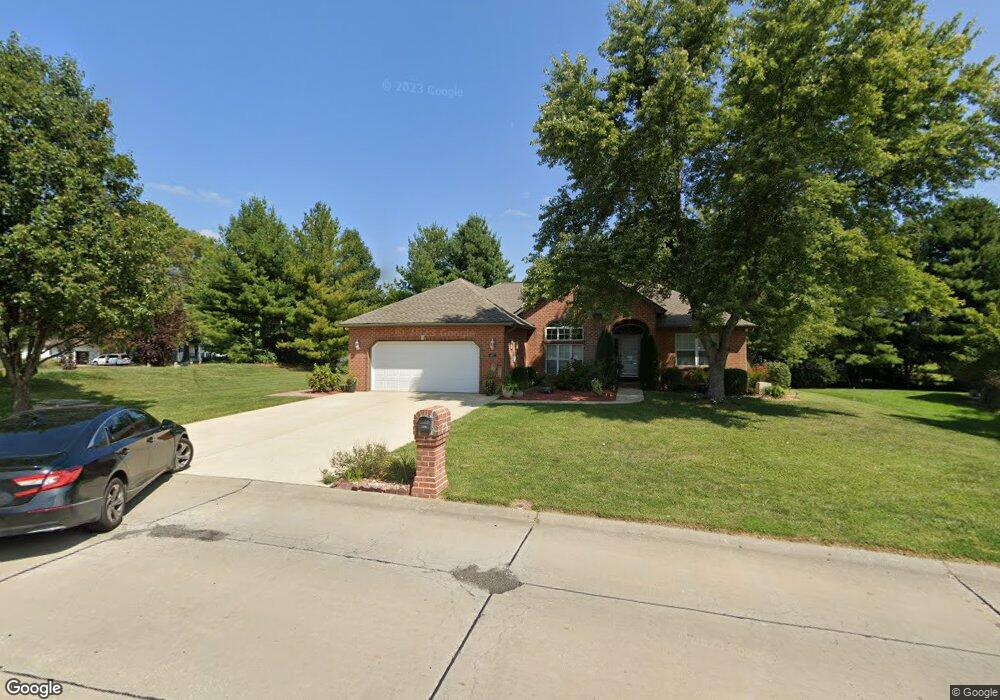
437 Meadowlark Ln Belleville, IL 62220
Estimated Value: $293,000 - $350,000
Studio
--
Bath
1,828
Sq Ft
$175/Sq Ft
Est. Value
About This Home
This home is located at 437 Meadowlark Ln, Belleville, IL 62220 and is currently estimated at $320,758, approximately $175 per square foot. 437 Meadowlark Ln is a home located in St. Clair County with nearby schools including Roosevelt Elementary School, Central Jr High School, and Governor French Academy.
Ownership History
Date
Name
Owned For
Owner Type
Purchase Details
Closed on
Jan 22, 2024
Sold by
Shoemaker Beverly A and Shoemaker Gary
Bought by
Shoemaker Beverly A
Current Estimated Value
Purchase Details
Closed on
Dec 10, 2020
Sold by
Shoemaker Gary and Shoemaker Beverly A
Bought by
Shoemaker Beverly A and Shoemaker Gary
Home Financials for this Owner
Home Financials are based on the most recent Mortgage that was taken out on this home.
Original Mortgage
$156,500
Interest Rate
4.12%
Mortgage Type
New Conventional
Purchase Details
Closed on
Aug 19, 2005
Sold by
Gdi Corp
Bought by
Shoemaker Gary and Giesegh Beverly
Home Financials for this Owner
Home Financials are based on the most recent Mortgage that was taken out on this home.
Original Mortgage
$211,900
Interest Rate
5.69%
Mortgage Type
Fannie Mae Freddie Mac
Purchase Details
Closed on
May 10, 2004
Sold by
Moerchen William J
Bought by
Gdi Corp
Create a Home Valuation Report for This Property
The Home Valuation Report is an in-depth analysis detailing your home's value as well as a comparison with similar homes in the area
Home Values in the Area
Average Home Value in this Area
Purchase History
| Date | Buyer | Sale Price | Title Company |
|---|---|---|---|
| Shoemaker Beverly A | -- | None Available | |
| Shoemaker Beverly A | -- | Title365 | |
| Shoemaker Gary | $212,000 | First American Title Insuran | |
| Gdi Corp | -- | -- | |
| Moerchen William J | -- | -- |
Source: Public Records
Mortgage History
| Date | Status | Borrower | Loan Amount |
|---|---|---|---|
| Previous Owner | Shoemaker Beverly A | $156,500 | |
| Previous Owner | Shoemaker Gary | $211,900 |
Source: Public Records
Tax History
| Year | Tax Paid | Tax Assessment Tax Assessment Total Assessment is a certain percentage of the fair market value that is determined by local assessors to be the total taxable value of land and additions on the property. | Land | Improvement |
|---|---|---|---|---|
| 2024 | $8,300 | $100,385 | $16,680 | $83,705 |
| 2023 | $7,539 | $86,314 | $16,350 | $69,964 |
| 2022 | $6,863 | $77,704 | $14,719 | $62,985 |
| 2021 | $6,564 | $71,835 | $13,607 | $58,228 |
| 2020 | $6,355 | $67,932 | $12,868 | $55,064 |
| 2019 | $6,419 | $67,960 | $12,889 | $55,071 |
| 2018 | $6,263 | $66,490 | $12,610 | $53,880 |
| 2017 | $6,215 | $66,022 | $12,521 | $53,501 |
| 2016 | $6,131 | $64,620 | $12,255 | $52,365 |
| 2014 | $5,380 | $64,188 | $8,734 | $55,454 |
| 2013 | $5,735 | $65,106 | $8,859 | $56,247 |
Source: Public Records
Map
Nearby Homes
- 49 Dianne Dr
- 218 Winterberry Dr
- 245 Summers Trace
- 516 Springwood Dr
- 130 Dianne Dr
- 1374 Rocky Creek Ct
- 1366 Radden Ct
- 34 Lake Forest Dr
- 1412 4th Ave
- 807 Gass Ave
- 1210 3rd Ave
- 420 State St
- 719 Centreville Ave
- 1500 State Street Rd
- 817 Union Ave
- 1800 Roosevelt Ave
- 1316 Raab Ave
- 419 S 8th St
- 611 Centreville Ave
- 1801 Roosevelt Ave
- 433 Meadowlark Ln
- 436 Meadowlark Ln
- 1809 Centreville Ave
- 1817 Centreville Ave
- 1805 Centreville Ave
- 429 Meadowlark Ln
- 432 Meadowlark Ln
- 1801 Centreville Ave
- 1821 Centreville Ave
- 1713 Centreville Ave
- 425 Meadowlark Ln
- 1709 Centreville Ave
- 1708 Menard Dr
- 1712 Menard Dr
- 1704 Menard Dr
- 1901 Centreville Ave
- 1716 Menard Dr
- 1904 Centreville Ave
- 1700 Menard Dr
- 1705 Centreville Ave
Your Personal Tour Guide
Ask me questions while you tour the home.