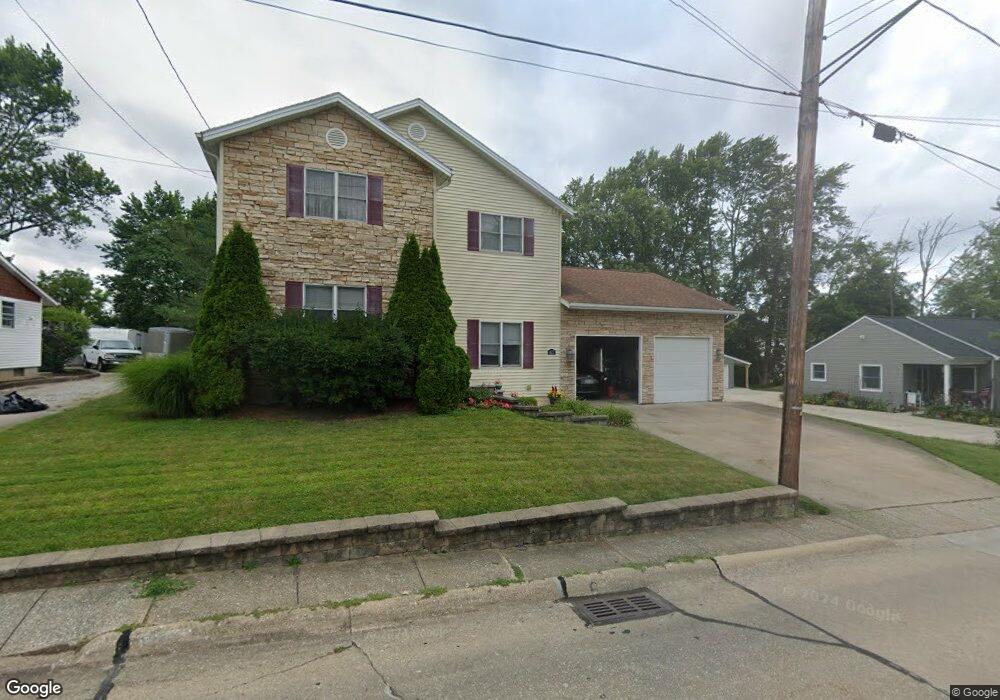
437 N Harmony St Medina, OH 44256
Estimated Value: $276,000 - $299,683
4
Beds
3
Baths
2,070
Sq Ft
$139/Sq Ft
Est. Value
About This Home
This home is located at 437 N Harmony St, Medina, OH 44256 and is currently estimated at $287,921, approximately $139 per square foot. 437 N Harmony St is a home located in Medina County with nearby schools including Sidney Fenn Elementary School, Claggett Middle School, and Medina High School.
Ownership History
Date
Name
Owned For
Owner Type
Purchase Details
Closed on
Dec 8, 2021
Sold by
Winkler Jason T and Winkler Stacy K
Bought by
Anderosac Teressa and Androsac Jeffrey T
Current Estimated Value
Home Financials for this Owner
Home Financials are based on the most recent Mortgage that was taken out on this home.
Original Mortgage
$208,160
Outstanding Balance
$191,529
Interest Rate
3.14%
Mortgage Type
FHA
Estimated Equity
$96,392
Purchase Details
Closed on
Oct 10, 2008
Sold by
Nagle Kristen M and Winkler Jason T
Bought by
Winkler Jason T
Home Financials for this Owner
Home Financials are based on the most recent Mortgage that was taken out on this home.
Original Mortgage
$178,908
Interest Rate
6.43%
Mortgage Type
FHA
Purchase Details
Closed on
Dec 12, 2005
Sold by
Hunt Robert A and Hunt Lisa M
Bought by
Nagle Kristen M and Winkler Jason T
Home Financials for this Owner
Home Financials are based on the most recent Mortgage that was taken out on this home.
Original Mortgage
$157,734
Interest Rate
6.2%
Mortgage Type
Fannie Mae Freddie Mac
Purchase Details
Closed on
Feb 22, 2001
Sold by
Mosgrove Lisa M and Mosgrove Dorsey D
Bought by
Hunt Robert A and Hunt Lisa M
Create a Home Valuation Report for This Property
The Home Valuation Report is an in-depth analysis detailing your home's value as well as a comparison with similar homes in the area
Home Values in the Area
Average Home Value in this Area
Purchase History
| Date | Buyer | Sale Price | Title Company |
|---|---|---|---|
| Anderosac Teressa | $212,000 | None Available | |
| Winkler Jason T | -- | -- | |
| Nagle Kristen M | $172,500 | Gateway Title Agency Inc | |
| Hunt Robert A | -- | -- |
Source: Public Records
Mortgage History
| Date | Status | Borrower | Loan Amount |
|---|---|---|---|
| Open | Anderosac Teressa | $208,160 | |
| Previous Owner | Winkler Jason T | $178,908 | |
| Previous Owner | Nagle Kristen M | $157,734 |
Source: Public Records
Tax History Compared to Growth
Tax History
| Year | Tax Paid | Tax Assessment Tax Assessment Total Assessment is a certain percentage of the fair market value that is determined by local assessors to be the total taxable value of land and additions on the property. | Land | Improvement |
|---|---|---|---|---|
| 2024 | $3,661 | $72,110 | $22,390 | $49,720 |
| 2023 | $3,661 | $72,110 | $22,390 | $49,720 |
| 2022 | $3,153 | $72,110 | $22,390 | $49,720 |
| 2021 | $3,300 | $62,310 | $17,630 | $44,680 |
| 2020 | $3,260 | $62,310 | $17,630 | $44,680 |
| 2019 | $3,204 | $62,310 | $17,630 | $44,680 |
| 2018 | $3,048 | $55,210 | $16,340 | $38,870 |
| 2017 | $3,091 | $55,210 | $16,340 | $38,870 |
| 2016 | $3,183 | $55,210 | $16,340 | $38,870 |
| 2015 | $3,486 | $50,190 | $14,850 | $35,340 |
| 2014 | $3,171 | $50,190 | $14,850 | $35,340 |
| 2013 | $3,028 | $50,190 | $14,850 | $35,340 |
Source: Public Records
Map
Nearby Homes
- 227 N East St
- 232 Howard St
- 560 Ridge Dr
- 2824 Grayson Dr
- 2846 Grayson Dr
- 530 Miller Dr
- 236 W Liberty St
- 243 W North St
- 754 N Huntington St
- 345 Roshon Dr
- 800 Wildwood Ct
- 990 Shorewood Dr
- 923 Sandy Ln
- 1073 N Jefferson St Unit B
- 330 Foundry St
- 1054 Cedarwood Ln
- 959 Sandy Ln
- 322 W Smith Rd
- 530 S Court St
- 217 Grant St Unit 219
- 433 N Harmony St
- 449 N Harmony St
- 441 N Harmony St
- 427 N Harmony St
- 440 N Harmony St
- 434 N Harmony St
- 453 N Harmony St Unit 455
- 446 N Harmony St
- 421 N Harmony St
- 453 455 Harmony St N
- 428 N Harmony St
- 452 N Harmony St
- 422 N Harmony St
- 463 465 Harmony St N
- 462 N Harmony St Unit 465
- 463 N Harmony St
- 458 N Harmony St
- 418 E Homestead St Unit 420
- 445 Ridge Dr
- 416 N Harmony St