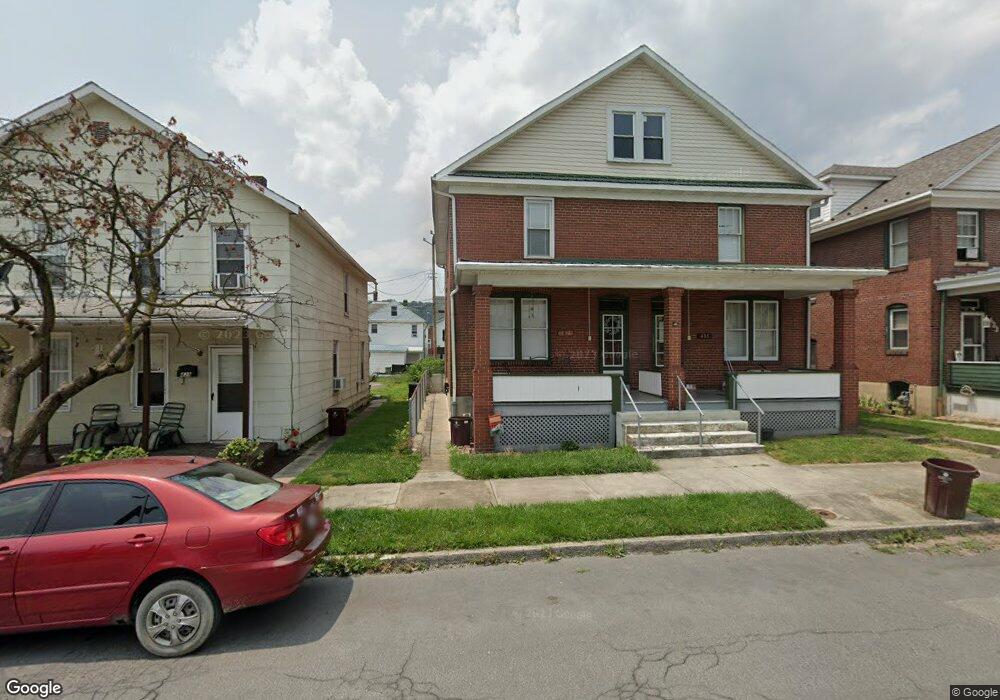
437 Race St Cumberland, MD 21502
Estimated Value: $79,000 - $104,000
--
Bed
1
Bath
1,360
Sq Ft
$65/Sq Ft
Est. Value
About This Home
This home is located at 437 Race St, Cumberland, MD 21502 and is currently estimated at $88,900, approximately $65 per square foot. 437 Race St is a home located in Allegany County with nearby schools including South Penn Elementary School, Washington Middle School, and Fort Hill High School.
Ownership History
Date
Name
Owned For
Owner Type
Purchase Details
Closed on
Oct 15, 2021
Sold by
Simpson Joyce
Bought by
Pravlik Richard and Eisel Sandra
Current Estimated Value
Home Financials for this Owner
Home Financials are based on the most recent Mortgage that was taken out on this home.
Original Mortgage
$68,000
Interest Rate
2.37%
Mortgage Type
Purchase Money Mortgage
Purchase Details
Closed on
Jun 17, 1997
Sold by
Poland Violet A
Bought by
Shaffer William C and Shaffer Randall K
Create a Home Valuation Report for This Property
The Home Valuation Report is an in-depth analysis detailing your home's value as well as a comparison with similar homes in the area
Home Values in the Area
Average Home Value in this Area
Purchase History
| Date | Buyer | Sale Price | Title Company |
|---|---|---|---|
| Pravlik Richard | $85,000 | Charter Title Llc | |
| Shaffer William C | $60,000 | -- |
Source: Public Records
Mortgage History
| Date | Status | Borrower | Loan Amount |
|---|---|---|---|
| Previous Owner | Pravlik Richard | $68,000 | |
| Closed | Shaffer William C | -- |
Source: Public Records
Tax History Compared to Growth
Tax History
| Year | Tax Paid | Tax Assessment Tax Assessment Total Assessment is a certain percentage of the fair market value that is determined by local assessors to be the total taxable value of land and additions on the property. | Land | Improvement |
|---|---|---|---|---|
| 2025 | $544 | $59,400 | $6,000 | $53,400 |
| 2024 | $556 | $59,400 | $6,000 | $53,400 |
| 2023 | $581 | $62,500 | $6,000 | $56,500 |
| 2022 | $662 | $62,500 | $6,000 | $56,500 |
| 2021 | $584 | $62,500 | $6,000 | $56,500 |
| 2020 | $623 | $67,100 | $6,000 | $61,100 |
| 2019 | $627 | $67,067 | $0 | $0 |
| 2018 | $632 | $67,033 | $0 | $0 |
| 2017 | $636 | $67,000 | $0 | $0 |
| 2016 | $642 | $67,000 | $0 | $0 |
| 2015 | $647 | $67,000 | $0 | $0 |
| 2014 | $647 | $67,000 | $0 | $0 |
Source: Public Records
Map
Nearby Homes