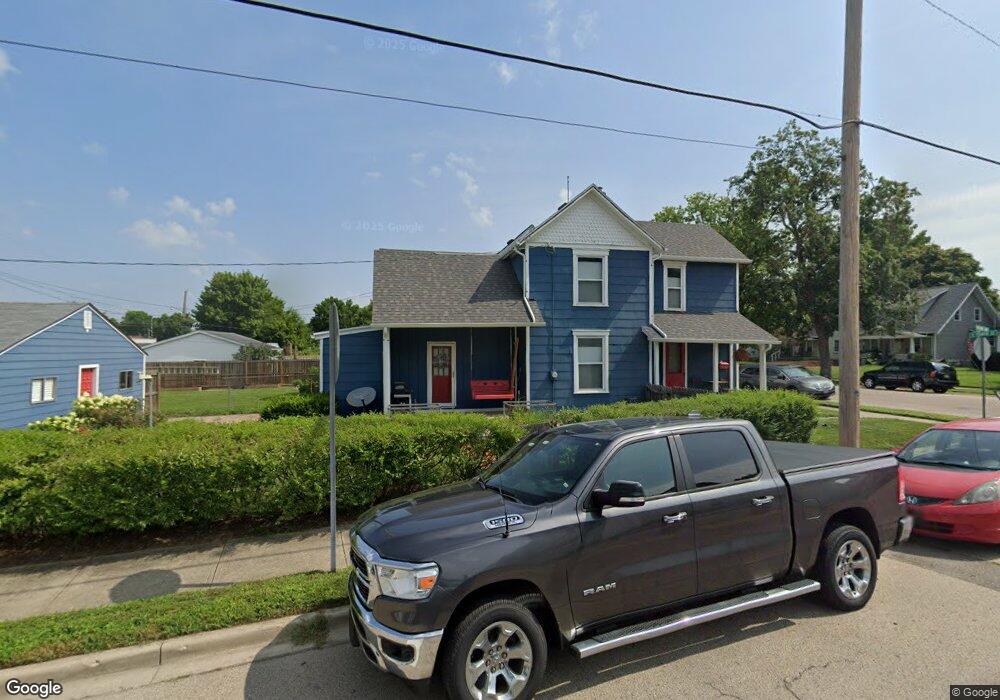
437 S 4th St Miamisburg, OH 45342
Downtown Miamisburg NeighborhoodEstimated Value: $146,000 - $217,000
3
Beds
2
Baths
1,240
Sq Ft
$151/Sq Ft
Est. Value
About This Home
This home is located at 437 S 4th St, Miamisburg, OH 45342 and is currently estimated at $186,741, approximately $150 per square foot. 437 S 4th St is a home located in Montgomery County with nearby schools including Miamisburg High School and Bethel Baptist School.
Ownership History
Date
Name
Owned For
Owner Type
Purchase Details
Closed on
Jul 7, 2021
Sold by
Duran Anthony
Bought by
Bean Joseph J and Bean Elizabeth S
Current Estimated Value
Home Financials for this Owner
Home Financials are based on the most recent Mortgage that was taken out on this home.
Original Mortgage
$128,000
Interest Rate
2.7%
Mortgage Type
New Conventional
Purchase Details
Closed on
May 19, 2017
Sold by
Irgens Kimberly L and Irgens Craig S
Bought by
Duran Anthony
Home Financials for this Owner
Home Financials are based on the most recent Mortgage that was taken out on this home.
Original Mortgage
$90,234
Interest Rate
4.4%
Mortgage Type
FHA
Purchase Details
Closed on
Aug 10, 2005
Sold by
Irgens Kimberly L and Kesling Jack E
Bought by
Irgens Craig S and Irgens Kimberly L
Home Financials for this Owner
Home Financials are based on the most recent Mortgage that was taken out on this home.
Original Mortgage
$88,000
Interest Rate
5.69%
Mortgage Type
New Conventional
Purchase Details
Closed on
Jan 30, 2003
Sold by
Day Kenneth L and Day Deborah A
Bought by
Day Kimberly L and Kesling Jack E
Home Financials for this Owner
Home Financials are based on the most recent Mortgage that was taken out on this home.
Original Mortgage
$93,532
Interest Rate
6.13%
Mortgage Type
FHA
Create a Home Valuation Report for This Property
The Home Valuation Report is an in-depth analysis detailing your home's value as well as a comparison with similar homes in the area
Home Values in the Area
Average Home Value in this Area
Purchase History
| Date | Buyer | Sale Price | Title Company |
|---|---|---|---|
| Bean Joseph J | $160,000 | Landmark Ttl Agcy South Inc | |
| Duran Anthony | $91,900 | None Available | |
| Irgens Craig S | -- | -- | |
| Day Kimberly L | $95,000 | -- |
Source: Public Records
Mortgage History
| Date | Status | Borrower | Loan Amount |
|---|---|---|---|
| Previous Owner | Bean Joseph J | $128,000 | |
| Previous Owner | Duran Anthony | $90,234 | |
| Previous Owner | Irgens Craig S | $88,000 | |
| Previous Owner | Day Kimberly L | $93,532 |
Source: Public Records
Tax History Compared to Growth
Tax History
| Year | Tax Paid | Tax Assessment Tax Assessment Total Assessment is a certain percentage of the fair market value that is determined by local assessors to be the total taxable value of land and additions on the property. | Land | Improvement |
|---|---|---|---|---|
| 2024 | $2,944 | $45,550 | $5,390 | $40,160 |
| 2023 | $2,944 | $45,550 | $5,390 | $40,160 |
| 2022 | $2,437 | $31,630 | $3,740 | $27,890 |
| 2021 | $2,161 | $31,630 | $3,740 | $27,890 |
| 2020 | $2,156 | $31,630 | $3,740 | $27,890 |
| 2019 | $1,995 | $26,780 | $3,740 | $23,040 |
| 2018 | $2,001 | $26,780 | $3,740 | $23,040 |
| 2017 | $2,041 | $26,780 | $3,740 | $23,040 |
| 2016 | $2,083 | $26,350 | $3,740 | $22,610 |
| 2015 | $2,084 | $26,350 | $3,740 | $22,610 |
| 2014 | $2,044 | $26,350 | $3,740 | $22,610 |
| 2012 | -- | $29,070 | $5,520 | $23,550 |
Source: Public Records
Map
Nearby Homes
- 513 Mound Ave
- 619 Jefferson St
- 235 S 7th St
- 150 S Main St
- 111 Old Main St
- 460 S 8th St
- 111 S Main St
- 42 S Main St
- 805 E Linden Ave
- 736 Park Ave
- 607 E Central Ave
- 24 S 8th St
- 740 E Central Ave
- 832 E Maple Ave
- 7 N Riverview Ave
- 265 S Riverview Ave
- 555 E Sycamore St
- 816 E Pearl St
- 319 N 1st St
- 1331 Cherry Hill Dr