437 S Main St Brigham City, UT 84302
--
Bed
--
Bath
2,224
Sq Ft
0.27
Acres
About This Home
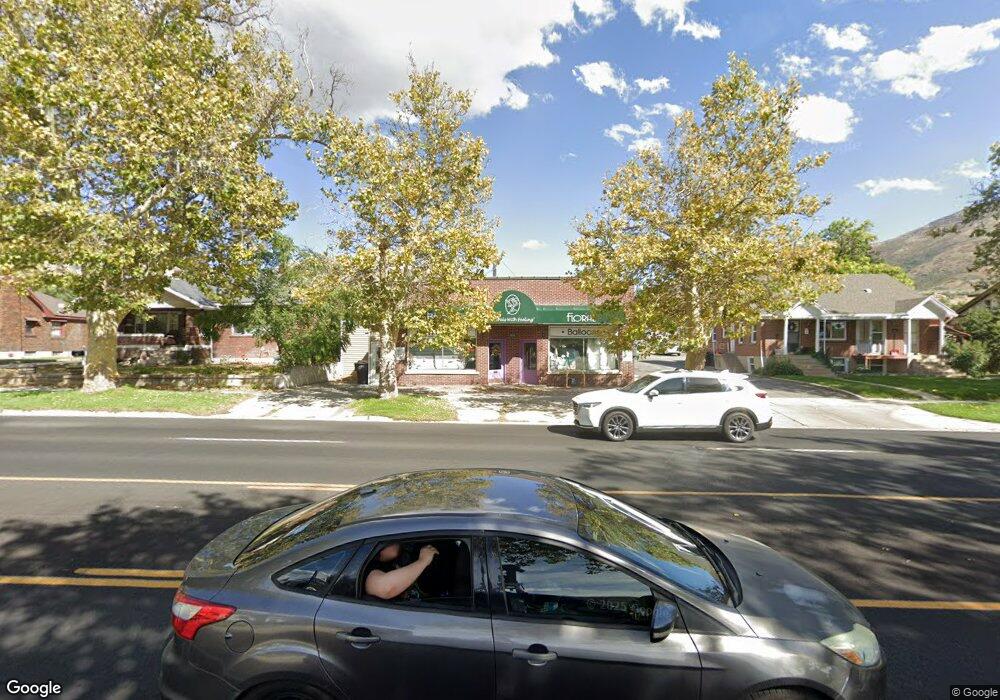
This home is located at 437 S Main St, Brigham City, UT 84302. 437 S Main St is a home located in Box Elder County with nearby schools including Box Elder Middle School, Adele C. Young Intermediate School, and Box Elder High School.
Ownership History
Date
Name
Owned For
Owner Type
Purchase Details
Closed on
Oct 13, 2023
Sold by
B & C Holdings Utah Llc
Bought by
Jade Worldwide Inc
Purchase Details
Closed on
Dec 21, 2022
Sold by
Crossman John Casey and Crossman Brittnee
Bought by
B & C Holdings Utah Llc
Purchase Details
Closed on
Nov 19, 2017
Sold by
Marshall Dawneen
Bought by
Crossman Brittnee and Crossman John
Home Financials for this Owner
Home Financials are based on the most recent Mortgage that was taken out on this home.
Original Mortgage
$150,000
Interest Rate
3.85%
Mortgage Type
Future Advance Clause Open End Mortgage
Create a Home Valuation Report for This Property
The Home Valuation Report is an in-depth analysis detailing your home's value as well as a comparison with similar homes in the area
Home Values in the Area
Average Home Value in this Area
Purchase History
| Date | Buyer | Sale Price | Title Company |
|---|---|---|---|
| Jade Worldwide Inc | -- | Us Title | |
| B & C Holdings Utah Llc | -- | -- | |
| Crossman Brittnee | -- | None Available |
Source: Public Records
Mortgage History
| Date | Status | Borrower | Loan Amount |
|---|---|---|---|
| Previous Owner | Crossman Brittnee | $150,000 |
Source: Public Records
Tax History Compared to Growth
Tax History
| Year | Tax Paid | Tax Assessment Tax Assessment Total Assessment is a certain percentage of the fair market value that is determined by local assessors to be the total taxable value of land and additions on the property. | Land | Improvement |
|---|---|---|---|---|
| 2025 | $2,875 | $327,866 | $70,566 | $257,300 |
| 2024 | $2,875 | $304,475 | $70,566 | $233,909 |
| 2023 | $2,808 | $304,475 | $70,566 | $233,909 |
| 2022 | $1,611 | $162,409 | $47,044 | $115,365 |
| 2021 | $1,770 | $162,409 | $47,044 | $115,365 |
| 2020 | $1,818 | $162,409 | $47,044 | $115,365 |
| 2019 | $1,879 | $162,409 | $47,044 | $115,365 |
| 2018 | $1,889 | $162,409 | $47,044 | $115,365 |
| 2017 | $757 | $62,000 | $43,600 | $18,400 |
| 2016 | $824 | $62,000 | $43,600 | $18,400 |
| 2015 | $855 | $62,000 | $43,600 | $18,400 |
| 2014 | $855 | $62,000 | $43,600 | $18,400 |
| 2013 | -- | $62,000 | $43,600 | $18,400 |
Source: Public Records
Map
Nearby Homes