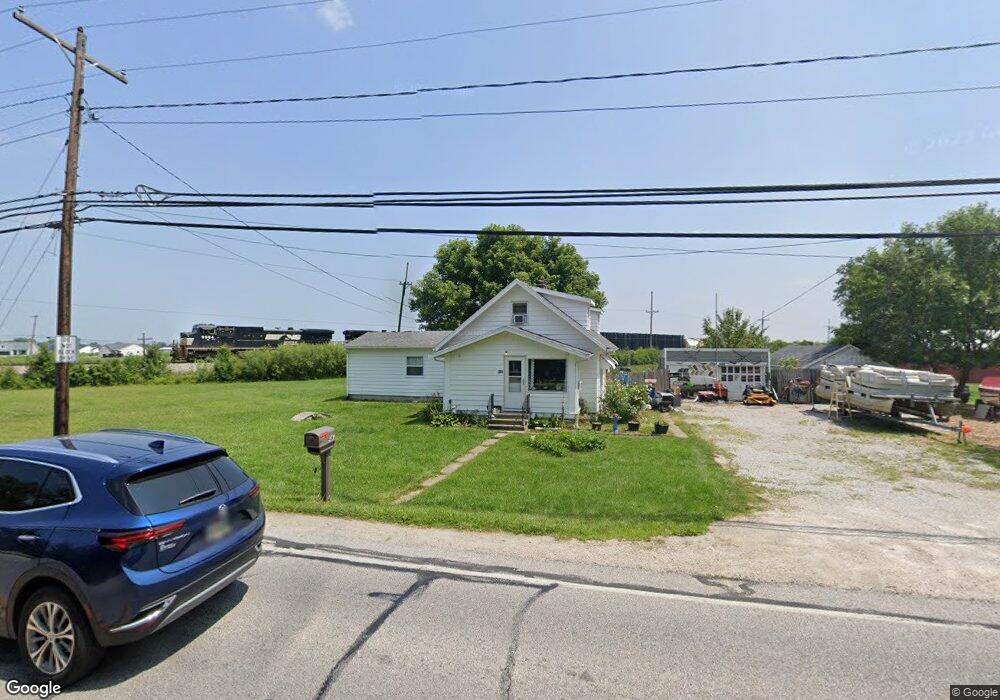
437 S Wynn Rd Oregon, OH 43616
Estimated Value: $92,421 - $257,000
--
Bed
--
Bath
--
Sq Ft
0.5
Acres
About This Home
This home is located at 437 S Wynn Rd, Oregon, OH 43616 and is currently estimated at $174,711. 437 S Wynn Rd is a home located in Lucas County with nearby schools including St. Kateri Catholic Schools, First St. John Day School, and Kateri Catholic Academy.
Ownership History
Date
Name
Owned For
Owner Type
Purchase Details
Closed on
Aug 14, 2019
Sold by
Jduran Properties Llc
Bought by
Ireland Ronald F and Ireland Jennifer L
Current Estimated Value
Home Financials for this Owner
Home Financials are based on the most recent Mortgage that was taken out on this home.
Interest Rate
3.6%
Purchase Details
Closed on
Jan 1, 2019
Sold by
Duran Corey
Bought by
Jduran Properties Llc
Purchase Details
Closed on
Oct 11, 2018
Sold by
Romstadt Bryon L
Bought by
Duran Corey
Purchase Details
Closed on
Dec 2, 2002
Sold by
Mchugh Sarah A
Bought by
Romstadt Bryon L and Romstadt Lori L
Purchase Details
Closed on
Feb 24, 1997
Sold by
Est Helen M Davies
Bought by
Hunt Richard
Home Financials for this Owner
Home Financials are based on the most recent Mortgage that was taken out on this home.
Original Mortgage
$67,680
Interest Rate
11.3%
Mortgage Type
New Conventional
Create a Home Valuation Report for This Property
The Home Valuation Report is an in-depth analysis detailing your home's value as well as a comparison with similar homes in the area
Home Values in the Area
Average Home Value in this Area
Purchase History
| Date | Buyer | Sale Price | Title Company |
|---|---|---|---|
| Ireland Ronald F | $98,000 | -- | |
| Jduran Properties Llc | $300 | None Available | |
| Duran Corey | $36,700 | None Available | |
| Romstadt Bryon L | $44,075 | Louisville Title Agency For | |
| Hunt Richard | $75,200 | -- |
Source: Public Records
Mortgage History
| Date | Status | Borrower | Loan Amount |
|---|---|---|---|
| Closed | Ireland Ronald F | -- | |
| Previous Owner | Hunt Richard | $67,680 |
Source: Public Records
Tax History Compared to Growth
Tax History
| Year | Tax Paid | Tax Assessment Tax Assessment Total Assessment is a certain percentage of the fair market value that is determined by local assessors to be the total taxable value of land and additions on the property. | Land | Improvement |
|---|---|---|---|---|
| 2024 | $198 | $8,155 | $5,635 | $2,520 |
| 2023 | $258 | $4,480 | $2,835 | $1,645 |
| 2022 | $260 | $4,480 | $2,835 | $1,645 |
| 2021 | $262 | $4,480 | $2,835 | $1,645 |
| 2020 | $240 | $3,640 | $2,345 | $1,295 |
| 2019 | $233 | $3,640 | $2,345 | $1,295 |
| 2018 | $203 | $3,640 | $2,345 | $1,295 |
| 2017 | $181 | $2,695 | $1,610 | $1,085 |
| 2016 | $178 | $7,700 | $4,600 | $3,100 |
| 2015 | $177 | $7,700 | $4,600 | $3,100 |
| 2014 | $165 | $2,630 | $1,580 | $1,050 |
| 2013 | $165 | $2,630 | $1,580 | $1,050 |
Source: Public Records
Map
Nearby Homes
- 5026 Easton Dr
- 5032 Easton Dr
- 5036 Easton Dr
- 5040 Easton Dr
- 5021 Easton Dr
- 5025 Easton Dr
- 5029 Easton Dr
- 5033 Easton Dr
- 5037 Easton Dr
- 5047 Noah Ln
- 5054 Magnolia Dr
- 5065 Magnolia Dr
- 234 Avilyn Ln
- 140 N Wynn Rd
- 5401 Pickle Rd
- 853 S Lallendorf Rd
- 203 Eastwood Ave
- 4263 Corduroy Rd
- 3860 Navarre Ave
- 1102 Heritage Ln