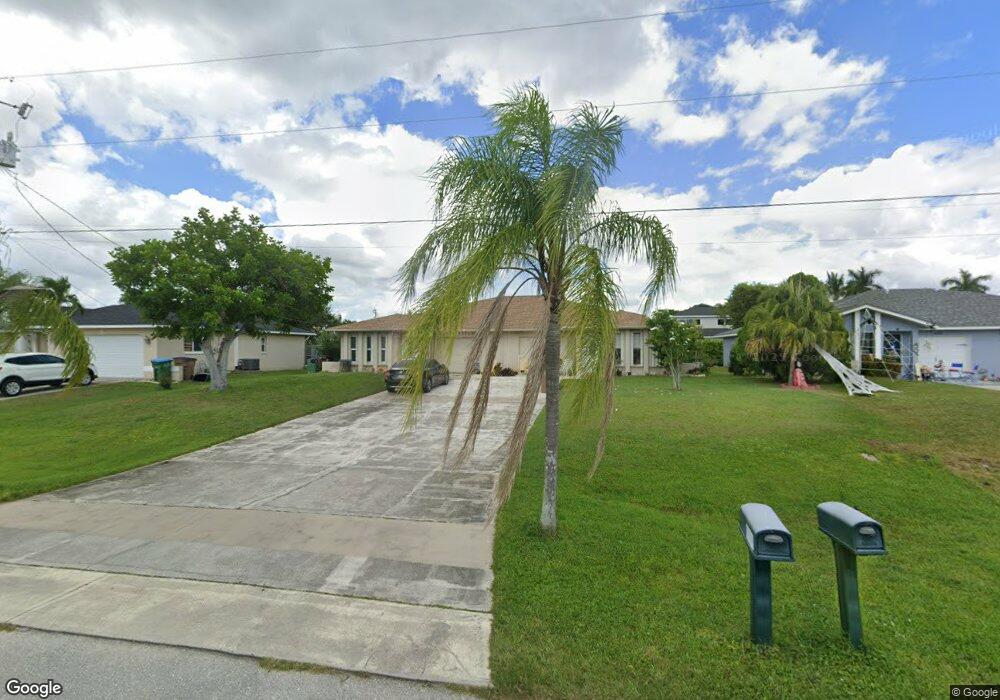
437 SW 19th St Cape Coral, FL 33991
Hancock NeighborhoodEstimated Value: $333,377 - $428,000
4
Beds
2
Baths
2,436
Sq Ft
$155/Sq Ft
Est. Value
About This Home
This home is located at 437 SW 19th St, Cape Coral, FL 33991 and is currently estimated at $377,344, approximately $154 per square foot. 437 SW 19th St is a home located in Lee County with nearby schools including Caloosa Elementary School, Cape Elementary School, and Tropic Isles Elementary School.
Ownership History
Date
Name
Owned For
Owner Type
Purchase Details
Closed on
Nov 18, 2022
Sold by
Nautilus Equity Group Llc
Bought by
Pelaez Fernando Reguero and Medina Mayelin Morejon
Current Estimated Value
Home Financials for this Owner
Home Financials are based on the most recent Mortgage that was taken out on this home.
Original Mortgage
$340,765
Outstanding Balance
$330,179
Interest Rate
6.94%
Mortgage Type
New Conventional
Estimated Equity
$47,165
Purchase Details
Closed on
Dec 1, 2009
Sold by
Herrera Jorge
Bought by
Nautilus Equity Group Llc
Purchase Details
Closed on
Jul 13, 2004
Sold by
Holiday Builders Inc
Bought by
Herrera Jorge
Home Financials for this Owner
Home Financials are based on the most recent Mortgage that was taken out on this home.
Original Mortgage
$140,648
Interest Rate
5.75%
Mortgage Type
Unknown
Purchase Details
Closed on
Jan 5, 2004
Sold by
Pelly Rene Luis and Pelly Luis Lourdes
Bought by
Holiday Bldr Inc
Purchase Details
Closed on
Aug 5, 2003
Sold by
Bennett Ken E
Bought by
Pelly Rene Luis and Pelly Luis Lourdes
Create a Home Valuation Report for This Property
The Home Valuation Report is an in-depth analysis detailing your home's value as well as a comparison with similar homes in the area
Home Values in the Area
Average Home Value in this Area
Purchase History
| Date | Buyer | Sale Price | Title Company |
|---|---|---|---|
| Pelaez Fernando Reguero | $358,700 | Florida Gulf Coast Title | |
| Pelaez Fernando Reguero | $358,700 | Florida Gulf Coast Title | |
| Nautilus Equity Group Llc | $90,700 | None Available | |
| Herrera Jorge | $175,900 | Hbi Title Company | |
| Holiday Bldr Inc | $16,500 | -- | |
| Holiday Bldr Inc | $16,500 | -- | |
| Pelly Rene Luis | $17,500 | -- |
Source: Public Records
Mortgage History
| Date | Status | Borrower | Loan Amount |
|---|---|---|---|
| Open | Pelaez Fernando Reguero | $340,765 | |
| Previous Owner | Herrera Jorge | $140,648 |
Source: Public Records
Tax History Compared to Growth
Tax History
| Year | Tax Paid | Tax Assessment Tax Assessment Total Assessment is a certain percentage of the fair market value that is determined by local assessors to be the total taxable value of land and additions on the property. | Land | Improvement |
|---|---|---|---|---|
| 2025 | $4,889 | $338,621 | -- | -- |
| 2024 | $6,107 | $243,236 | -- | -- |
| 2023 | $6,107 | $236,151 | $0 | $0 |
| 2022 | $6,691 | $209,818 | $0 | $0 |
| 2021 | $6,180 | $190,744 | $16,000 | $174,744 |
| 2020 | $6,329 | $178,464 | $13,600 | $164,864 |
| 2019 | $6,185 | $172,815 | $17,000 | $155,815 |
| 2018 | $6,067 | $174,428 | $20,500 | $153,928 |
| 2017 | $3,396 | $169,584 | $8,000 | $161,584 |
| 2016 | $3,107 | $149,978 | $8,000 | $141,978 |
| 2015 | $2,877 | $132,507 | $6,800 | $125,707 |
| 2014 | -- | $124,207 | $5,922 | $118,285 |
| 2013 | -- | $113,612 | $4,600 | $109,012 |
Source: Public Records
Map
Nearby Homes
- 1222 SE 18th Terrace
- 1433 SE 19th Terrace
- 1439 SE 18th St
- 1220 SE 19th Ln
- 1405 SE 17th St
- 1122 SE 19th St
- 1902 SE 15th Place
- 1447 SE 17th Terrace
- 1806 SE 15th Place
- 1438 SE 20th St
- 1512 SE 17th Terrace
- 1516 SE 20th St
- 1507 SE 21st St
- 1202 SE 21st St
- 1103 SE 18th St
- 1321 SE 21st Ln
- 1215 SE 16th St
- 1449 SE 16th St
- 1104 SE 16th Terrace
- 1314 SE 15th Terrace
- 1411 SE 19th St
- 1411 SE 19th St
- 1415 SE 19th St
- 1410 SE 18th Terrace
- 1414 SE 18th Terrace
- 1407 SE 19th St
- 1419 SE 19th St
- 1418 SE 18th Terrace
- 1403 SE 19th St
- 1402 SE 18th Terrace
- 1423 SE 19th St
- 1422 SE 18th Terrace
- 1412 SE 19th St
- 1416 SE 19th St
- 1408 SE 19th St
- 1420 SE 19th St
- 1407 SE 18th Terrace
- 1419 SE 18th Terrace
- 1404 SE 19th St
- 1427 SE 19th St