437 Tokay Ct Unit 42C Cincinnati, OH 45255
Estimated Value: $216,530 - $244,000
2
Beds
2
Baths
1,280
Sq Ft
$183/Sq Ft
Est. Value
About This Home
This home is located at 437 Tokay Ct Unit 42C, Cincinnati, OH 45255 and is currently estimated at $234,383, approximately $183 per square foot. 437 Tokay Ct Unit 42C is a home located in Clermont County with nearby schools including Withamsville-Tobasco Elementary School, West Clermont Middle School, and West Clermont High School.
Ownership History
Date
Name
Owned For
Owner Type
Purchase Details
Closed on
Feb 27, 2006
Sold by
Bail Joshua A
Bought by
Bauer Renee
Current Estimated Value
Home Financials for this Owner
Home Financials are based on the most recent Mortgage that was taken out on this home.
Original Mortgage
$100,000
Outstanding Balance
$57,049
Interest Rate
6.33%
Mortgage Type
Fannie Mae Freddie Mac
Estimated Equity
$177,334
Purchase Details
Closed on
May 19, 2004
Sold by
Green Karen A
Bought by
Bail Joshua A
Home Financials for this Owner
Home Financials are based on the most recent Mortgage that was taken out on this home.
Original Mortgage
$111,500
Interest Rate
5.85%
Mortgage Type
Unknown
Purchase Details
Closed on
Aug 6, 1999
Sold by
Drees Co
Bought by
Collins Wanda L
Home Financials for this Owner
Home Financials are based on the most recent Mortgage that was taken out on this home.
Original Mortgage
$75,000
Interest Rate
7.68%
Mortgage Type
New Conventional
Create a Home Valuation Report for This Property
The Home Valuation Report is an in-depth analysis detailing your home's value as well as a comparison with similar homes in the area
Home Values in the Area
Average Home Value in this Area
Purchase History
| Date | Buyer | Sale Price | Title Company |
|---|---|---|---|
| Bauer Renee | $128,000 | Vintage Title Agency | |
| Bail Joshua A | -- | Huntington Title Services | |
| Green Karen A | $121,500 | Huntington Title Services | |
| Collins Wanda L | $113,600 | -- |
Source: Public Records
Mortgage History
| Date | Status | Borrower | Loan Amount |
|---|---|---|---|
| Open | Bauer Renee | $100,000 | |
| Previous Owner | Bail Joshua A | $111,500 | |
| Previous Owner | Collins Wanda L | $75,000 |
Source: Public Records
Tax History Compared to Growth
Tax History
| Year | Tax Paid | Tax Assessment Tax Assessment Total Assessment is a certain percentage of the fair market value that is determined by local assessors to be the total taxable value of land and additions on the property. | Land | Improvement |
|---|---|---|---|---|
| 2024 | $3,039 | $60,270 | $15,750 | $44,520 |
| 2023 | $3,044 | $60,270 | $15,750 | $44,520 |
| 2022 | $2,808 | $48,200 | $12,600 | $35,600 |
| 2021 | $2,820 | $48,200 | $12,600 | $35,600 |
| 2020 | $2,823 | $48,200 | $12,600 | $35,600 |
| 2019 | $2,243 | $44,770 | $12,600 | $32,170 |
| 2018 | $2,266 | $44,770 | $12,600 | $32,170 |
| 2017 | $2,160 | $44,770 | $12,600 | $32,170 |
| 2016 | $2,086 | $37,310 | $10,500 | $26,810 |
| 2015 | $2,024 | $37,310 | $10,500 | $26,810 |
| 2014 | $2,024 | $37,310 | $10,500 | $26,810 |
| 2013 | $2,046 | $37,310 | $10,500 | $26,810 |
Source: Public Records
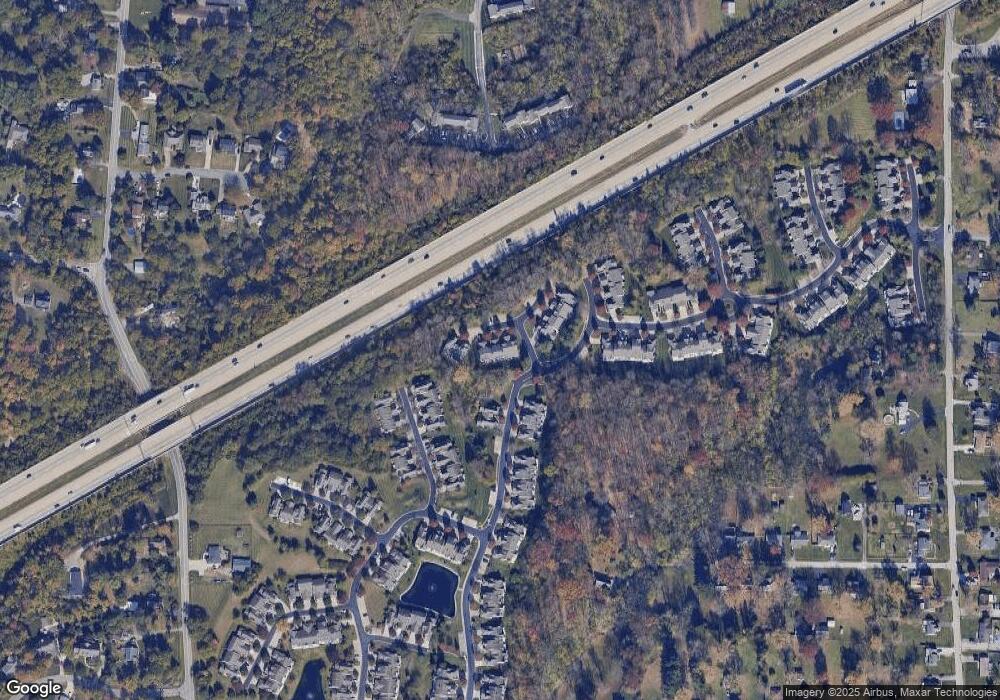
Map
Nearby Homes
- 3910 Vineyard Green Dr
- 854 Nordyke Rd
- 464 Lenkenann Dr
- 3810 Arbor Ln
- 3879 Mark Ct
- 535 Davis Rd
- 537 Davis Rd
- 1007 Nottingham Dr
- 497 Mapleport Way
- 539 Davis Rd
- 3986 Maplefield Ct
- 541 Davis Rd
- 3875 Michael Dr
- 3892 Michael Dr
- 595 Davis Rd
- 1144 White Pine Ct
- 3805 9 Mile Rd
- 8512 Prilla Ln
- 8538 Sunmont Dr
- 604 Legend Hills
- 439 Tokay Ct Unit 42B
- 435 Tokay Ct Unit 42D
- 433 Tokay Ct
- 441 Tokay Ct Unit 42A
- 431 Tokay Ct
- 429 Tokay Ct Unit 43A
- 427 Tokay Ct Unit 43B
- 443 Tokay Ct
- 3820 Hank Woods Ln
- 445 Tokay Ct Unit 41E
- 3911 Vineyard Green Dr
- 447 Tokay Ct Unit 41D
- 3914 Vineyard Green Dr
- 449 Tokay Ct Unit 41C
- 3909 Vineyard Green Dr
- 451 Tokay Ct Unit 41B
- 3912 Vineyard Green Dr
- 3912 Vineyard Green Dr Unit Condo in Anderson CI
- 3914 Beranger Ct
- 3918 Beranger Ct