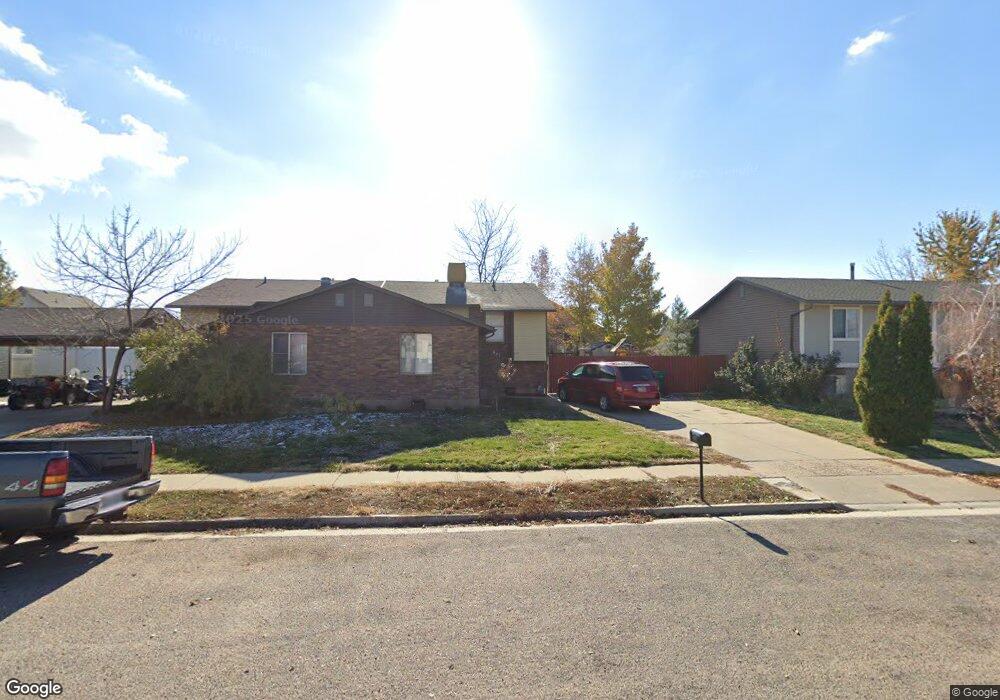
437 W 2500 S Clearfield, UT 84015
Estimated Value: $348,000 - $389,537
3
Beds
2
Baths
1,693
Sq Ft
$217/Sq Ft
Est. Value
About This Home
This home is located at 437 W 2500 S, Clearfield, UT 84015 and is currently estimated at $366,884, approximately $216 per square foot. 437 W 2500 S is a home located in Davis County with nearby schools including Antelope Elementary School, North Davis Junior High School, and Clearfield High School.
Ownership History
Date
Name
Owned For
Owner Type
Purchase Details
Closed on
Apr 8, 2019
Sold by
Christopherson Justin
Bought by
Christopherson Justin and Christopherson Annalee
Current Estimated Value
Home Financials for this Owner
Home Financials are based on the most recent Mortgage that was taken out on this home.
Original Mortgage
$10,427
Outstanding Balance
$9,167
Interest Rate
4.4%
Mortgage Type
Stand Alone Second
Estimated Equity
$357,717
Purchase Details
Closed on
Apr 5, 2019
Sold by
Bnl Investments Llc
Bought by
Christopherson Justin
Home Financials for this Owner
Home Financials are based on the most recent Mortgage that was taken out on this home.
Original Mortgage
$10,427
Outstanding Balance
$9,167
Interest Rate
4.4%
Mortgage Type
Stand Alone Second
Estimated Equity
$357,717
Purchase Details
Closed on
Sep 28, 2017
Sold by
Weaver Lewis
Bought by
Bnl Investments Llc
Home Financials for this Owner
Home Financials are based on the most recent Mortgage that was taken out on this home.
Original Mortgage
$102,000
Interest Rate
3.82%
Mortgage Type
New Conventional
Purchase Details
Closed on
Apr 18, 2008
Sold by
Barker Casey
Bought by
Barker Casey L and Barker Kristine M
Home Financials for this Owner
Home Financials are based on the most recent Mortgage that was taken out on this home.
Original Mortgage
$106,400
Interest Rate
5.99%
Mortgage Type
New Conventional
Purchase Details
Closed on
Jan 29, 2008
Sold by
Vanbuskirk Paul and Buskirk Jena Van
Bought by
Barker Casey
Home Financials for this Owner
Home Financials are based on the most recent Mortgage that was taken out on this home.
Original Mortgage
$101,920
Interest Rate
6.04%
Mortgage Type
Purchase Money Mortgage
Purchase Details
Closed on
Jun 15, 2005
Sold by
H & E Sales Llc
Bought by
Vanbuskirk Paul and Van Buskirk Jena
Home Financials for this Owner
Home Financials are based on the most recent Mortgage that was taken out on this home.
Original Mortgage
$21,200
Interest Rate
5.65%
Mortgage Type
Stand Alone Second
Purchase Details
Closed on
Mar 24, 2005
Sold by
Lucovitz Monica L
Bought by
H & E Sales Llc
Purchase Details
Closed on
Oct 23, 1997
Sold by
Glass Hank and Glass Linda
Bought by
Lucovitz Monica L
Home Financials for this Owner
Home Financials are based on the most recent Mortgage that was taken out on this home.
Original Mortgage
$82,311
Interest Rate
7.49%
Mortgage Type
FHA
Create a Home Valuation Report for This Property
The Home Valuation Report is an in-depth analysis detailing your home's value as well as a comparison with similar homes in the area
Home Values in the Area
Average Home Value in this Area
Purchase History
| Date | Buyer | Sale Price | Title Company |
|---|---|---|---|
| Christopherson Justin | -- | Integrated Title Insu | |
| Christopherson Justin | -- | Metro National Title | |
| Bnl Investments Llc | -- | Inwest Title | |
| Weaver Lewis | -- | -- | |
| Barker Casey L | -- | Simple Title & Escrow Llc | |
| Barker Casey | -- | Simple Title & Escrow Llc | |
| Vanbuskirk Paul | -- | Backman Stewart Title Svcs | |
| H & E Sales Llc | -- | First American Title | |
| Lucovitz Monica L | -- | Founders Title Company |
Source: Public Records
Mortgage History
| Date | Status | Borrower | Loan Amount |
|---|---|---|---|
| Open | Christopherson Justin | $10,427 | |
| Open | Christopherson Justin | $208,550 | |
| Previous Owner | Bnl Investments Llc | $102,000 | |
| Previous Owner | Barker Casey L | $106,400 | |
| Previous Owner | Barker Casey | $101,920 | |
| Previous Owner | Vanbuskirk Paul | $21,200 | |
| Previous Owner | Vanbuskirk Paul | $84,800 | |
| Previous Owner | Lucovitz Monica L | $82,311 | |
| Closed | Lucovitz Monica L | $3,300 |
Source: Public Records
Tax History Compared to Growth
Tax History
| Year | Tax Paid | Tax Assessment Tax Assessment Total Assessment is a certain percentage of the fair market value that is determined by local assessors to be the total taxable value of land and additions on the property. | Land | Improvement |
|---|---|---|---|---|
| 2025 | $2,105 | $188,650 | $60,124 | $128,526 |
| 2024 | $2,059 | $185,900 | $57,561 | $128,339 |
| 2023 | $1,931 | $320,000 | $93,229 | $226,771 |
| 2022 | $1,982 | $177,650 | $54,579 | $123,071 |
| 2021 | $1,773 | $240,000 | $52,353 | $187,647 |
| 2020 | $1,347 | $181,057 | $43,057 | $138,000 |
| 2019 | $1,228 | $163,000 | $25,000 | $138,000 |
| 2018 | $1,090 | $141,000 | $25,000 | $116,000 |
| 2016 | $831 | $56,210 | $13,750 | $42,460 |
| 2015 | $816 | $52,580 | $13,750 | $38,830 |
| 2014 | $660 | $43,120 | $16,938 | $26,182 |
| 2013 | -- | $52,575 | $24,126 | $28,449 |
Source: Public Records
Map
Nearby Homes