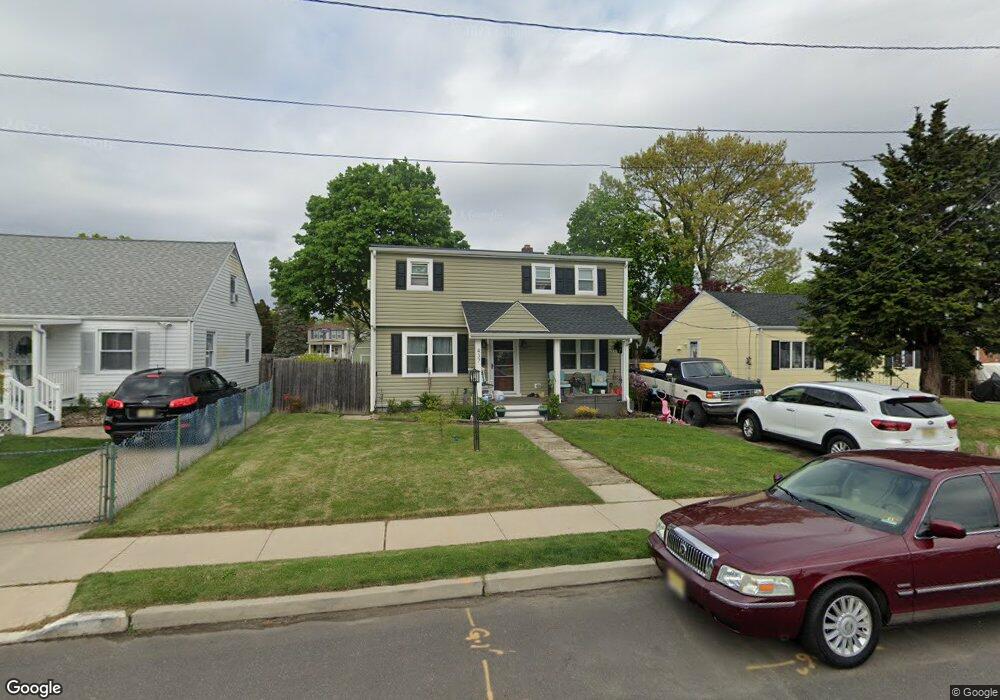
437 W 5th St Florence, NJ 08518
Estimated Value: $283,000 - $334,000
4
Beds
2
Baths
1,260
Sq Ft
$245/Sq Ft
Est. Value
About This Home
This home is located at 437 W 5th St, Florence, NJ 08518 and is currently estimated at $309,033, approximately $245 per square foot. 437 W 5th St is a home located in Burlington County with nearby schools including Riverfront Middle School, Number 5, Roebling Elementary School, and Florence Twp Mem High School.
Ownership History
Date
Name
Owned For
Owner Type
Purchase Details
Closed on
Mar 28, 2017
Sold by
Nyul Edward and Nyul Marie
Bought by
Nyul Ashley and Klenk David
Current Estimated Value
Home Financials for this Owner
Home Financials are based on the most recent Mortgage that was taken out on this home.
Original Mortgage
$142,908
Outstanding Balance
$120,636
Interest Rate
4.75%
Mortgage Type
FHA
Estimated Equity
$188,397
Purchase Details
Closed on
Jun 14, 1988
Bought by
Nyul Edward and Nyul Marie
Create a Home Valuation Report for This Property
The Home Valuation Report is an in-depth analysis detailing your home's value as well as a comparison with similar homes in the area
Home Values in the Area
Average Home Value in this Area
Purchase History
| Date | Buyer | Sale Price | Title Company |
|---|---|---|---|
| Nyul Ashley | $120,000 | None Available | |
| Nyul Edward | $82,100 | -- |
Source: Public Records
Mortgage History
| Date | Status | Borrower | Loan Amount |
|---|---|---|---|
| Open | Nyul Ashley | $142,908 |
Source: Public Records
Tax History Compared to Growth
Tax History
| Year | Tax Paid | Tax Assessment Tax Assessment Total Assessment is a certain percentage of the fair market value that is determined by local assessors to be the total taxable value of land and additions on the property. | Land | Improvement |
|---|---|---|---|---|
| 2025 | $4,808 | $172,500 | $67,500 | $105,000 |
| 2024 | $4,602 | $172,500 | $67,500 | $105,000 |
| 2023 | $4,602 | $172,500 | $67,500 | $105,000 |
| 2022 | $4,504 | $172,500 | $67,500 | $105,000 |
| 2021 | $4,464 | $172,500 | $67,500 | $105,000 |
| 2020 | $4,447 | $172,500 | $67,500 | $105,000 |
| 2019 | $4,407 | $172,500 | $67,500 | $105,000 |
| 2018 | $4,200 | $165,800 | $67,500 | $98,300 |
| 2017 | $4,148 | $165,800 | $67,500 | $98,300 |
| 2016 | $4,069 | $165,800 | $67,500 | $98,300 |
| 2015 | $4,556 | $189,500 | $75,000 | $114,500 |
| 2014 | $4,429 | $189,500 | $75,000 | $114,500 |
Source: Public Records
Map
Nearby Homes
- 0 W 3rd St Unit BLOCK 38 LOT 3.02
- 0 W 3rd St Unit BLOCK 38 LOT 3.03
- 623 W 3rd St
- 438 W Front St
- 323 W 4th St
- 201 W Front St
- 400 Szypulski Ln
- 1026 W 5th St
- 202 Foundry St
- 323 Pigott Dr
- 1006 W 3rd St
- 310 Riverview Ave
- 1000 W Front St
- 28 W 3rd St
- 10 W 5th St
- 201 Broad St
- 217 E 4th St
- 7 -1 Florence Tollgate Place Unit 1
- 12 -4 Florence Tollgate
- 16 -4 Florence Tollgate