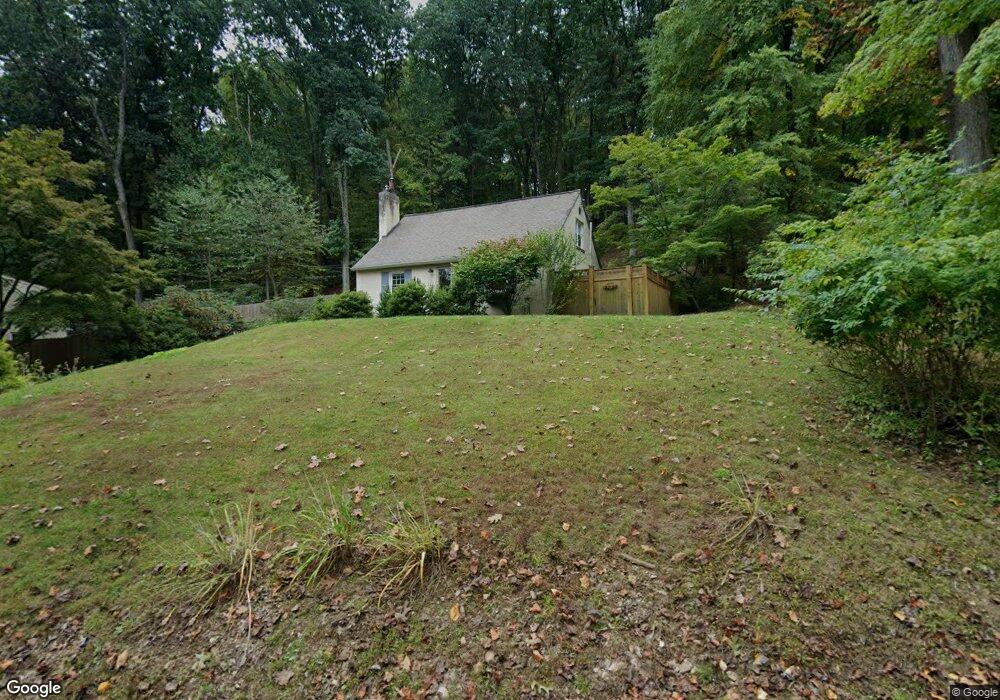
437 Weadley Rd King of Prussia, PA 19406
Estimated Value: $521,121 - $545,000
2
Beds
2
Baths
1,165
Sq Ft
$461/Sq Ft
Est. Value
About This Home
This home is located at 437 Weadley Rd, King of Prussia, PA 19406 and is currently estimated at $537,280, approximately $461 per square foot. 437 Weadley Rd is a home located in Montgomery County with nearby schools including Roberts Elementary School, Upper Merion Middle School, and Upper Merion High School.
Ownership History
Date
Name
Owned For
Owner Type
Purchase Details
Closed on
Sep 25, 2024
Sold by
Dixon Lisa Honjo and Dixon Christopher B
Bought by
Nigh Ryan and Farmer Lydia
Current Estimated Value
Home Financials for this Owner
Home Financials are based on the most recent Mortgage that was taken out on this home.
Original Mortgage
$459,000
Outstanding Balance
$454,274
Interest Rate
6.46%
Mortgage Type
New Conventional
Estimated Equity
$83,006
Purchase Details
Closed on
Mar 17, 2006
Sold by
Reif Carmen A
Bought by
Honjo Lisa and Dixon Christopher B
Home Financials for this Owner
Home Financials are based on the most recent Mortgage that was taken out on this home.
Original Mortgage
$44,250
Interest Rate
6.32%
Purchase Details
Closed on
Apr 30, 1996
Sold by
Demko Michael G and Demko Mary T
Bought by
Reiff Carmen A
Create a Home Valuation Report for This Property
The Home Valuation Report is an in-depth analysis detailing your home's value as well as a comparison with similar homes in the area
Home Values in the Area
Average Home Value in this Area
Purchase History
| Date | Buyer | Sale Price | Title Company |
|---|---|---|---|
| Nigh Ryan | $510,000 | Sqs Square Settlements | |
| Honjo Lisa | $295,000 | None Available | |
| Reiff Carmen A | $158,300 | -- |
Source: Public Records
Mortgage History
| Date | Status | Borrower | Loan Amount |
|---|---|---|---|
| Open | Nigh Ryan | $459,000 | |
| Previous Owner | Honjo Lisa | $44,250 | |
| Previous Owner | Honjo Lisa | $236,000 |
Source: Public Records
Tax History Compared to Growth
Tax History
| Year | Tax Paid | Tax Assessment Tax Assessment Total Assessment is a certain percentage of the fair market value that is determined by local assessors to be the total taxable value of land and additions on the property. | Land | Improvement |
|---|---|---|---|---|
| 2025 | $4,309 | $139,810 | $67,260 | $72,550 |
| 2024 | $4,309 | $139,810 | $67,260 | $72,550 |
| 2023 | $4,156 | $139,810 | $67,260 | $72,550 |
| 2022 | $3,978 | $139,810 | $67,260 | $72,550 |
| 2021 | $3,855 | $139,810 | $67,260 | $72,550 |
| 2020 | $3,684 | $139,810 | $67,260 | $72,550 |
| 2019 | $3,621 | $139,810 | $67,260 | $72,550 |
| 2018 | $3,622 | $139,810 | $67,260 | $72,550 |
| 2017 | $3,491 | $139,810 | $67,260 | $72,550 |
| 2016 | $3,437 | $139,810 | $67,260 | $72,550 |
| 2015 | $3,310 | $139,810 | $67,260 | $72,550 |
| 2014 | $3,310 | $139,810 | $67,260 | $72,550 |
Source: Public Records
Map
Nearby Homes
- 424 Weadley Rd
- 301 Hughes Rd
- 679 Crestwood Rd
- 359 Valley View Rd
- 906 Bismark Way
- 400 Highview Dr
- 744 School Line Dr
- 156 Gypsy Ln
- 700 Crooked Ln
- 161 Lantern Ln
- 190 Pine Tree Rd
- 123 Gypsy Ln
- 188 Arden Rd
- 0 Renaissance Blvd
- 356 King of Prussia Rd
- 545 Kingwood Rd
- Lot 1 Arden Rd
- Lot 3 Arden Rd
- 569 Kingwood Rd
- 2 Arden Rd
- 443 Weadley Rd
- 431 Weadley Rd
- 425 Weadley Rd
- 476 Weadley Rd
- 501 Weadley Rd
- 444 Weadley Rd
- 504 Weadley Rd
- 500 Hughes Rd
- 492 Weadley Rd
- 509 Weadley Rd
- 436 Weadley Rd
- 419 Weadley Rd
- 510 Weadley Rd
- 411 Weadley Rd
- 418 Weadley Rd
- 677 Shoemaker Ln
- 680 Shoemaker Ln
- 517 Weadley Rd
- 520 Weadley Rd
- 673 Shoemaker Ln