Estimated Value: $94,000 - $127,000
2
Beds
1
Bath
720
Sq Ft
$143/Sq Ft
Est. Value
About This Home
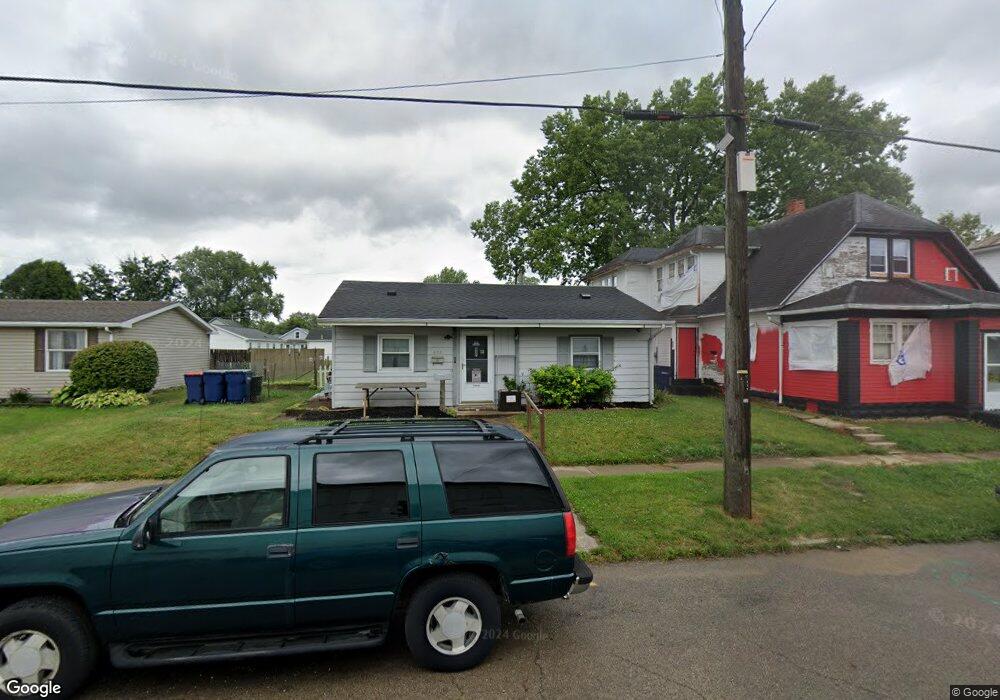
This home is located at 437 Weber St, Piqua, OH 45356 and is currently estimated at $102,727, approximately $142 per square foot. 437 Weber St is a home located in Miami County with nearby schools including Piqua Junior High School, Piqua High School, and Nicholas School.
Ownership History
Date
Name
Owned For
Owner Type
Purchase Details
Closed on
May 18, 2010
Sold by
The Estate Of Almeda F Buroker
Bought by
Pack William
Current Estimated Value
Home Financials for this Owner
Home Financials are based on the most recent Mortgage that was taken out on this home.
Original Mortgage
$39,368
Outstanding Balance
$26,529
Interest Rate
5.16%
Mortgage Type
FHA
Estimated Equity
$76,198
Purchase Details
Closed on
Jun 21, 1994
Sold by
Mcgillvary Gregory
Bought by
Buroker F Almeda
Create a Home Valuation Report for This Property
The Home Valuation Report is an in-depth analysis detailing your home's value as well as a comparison with similar homes in the area
Home Values in the Area
Average Home Value in this Area
Purchase History
| Date | Buyer | Sale Price | Title Company |
|---|---|---|---|
| Pack William | $39,900 | -- | |
| Buroker F Almeda | $35,000 | -- |
Source: Public Records
Mortgage History
| Date | Status | Borrower | Loan Amount |
|---|---|---|---|
| Open | Pack William | $39,368 | |
| Closed | Buroker F Almeda | -- |
Source: Public Records
Tax History Compared to Growth
Tax History
| Year | Tax Paid | Tax Assessment Tax Assessment Total Assessment is a certain percentage of the fair market value that is determined by local assessors to be the total taxable value of land and additions on the property. | Land | Improvement |
|---|---|---|---|---|
| 2024 | $407 | $19,710 | $6,620 | $13,090 |
| 2023 | $407 | $19,710 | $6,620 | $13,090 |
| 2022 | $458 | $19,710 | $6,620 | $13,090 |
| 2021 | $267 | $14,600 | $4,900 | $9,700 |
| 2020 | $262 | $14,600 | $4,900 | $9,700 |
| 2019 | $264 | $14,600 | $4,900 | $9,700 |
| 2018 | $215 | $13,300 | $4,900 | $8,400 |
| 2017 | $635 | $13,300 | $4,900 | $8,400 |
| 2016 | $628 | $13,300 | $4,900 | $8,400 |
| 2015 | $620 | $12,820 | $4,730 | $8,090 |
| 2014 | $620 | $12,820 | $4,730 | $8,090 |
| 2013 | $622 | $12,820 | $4,730 | $8,090 |
Source: Public Records
Map
Nearby Homes