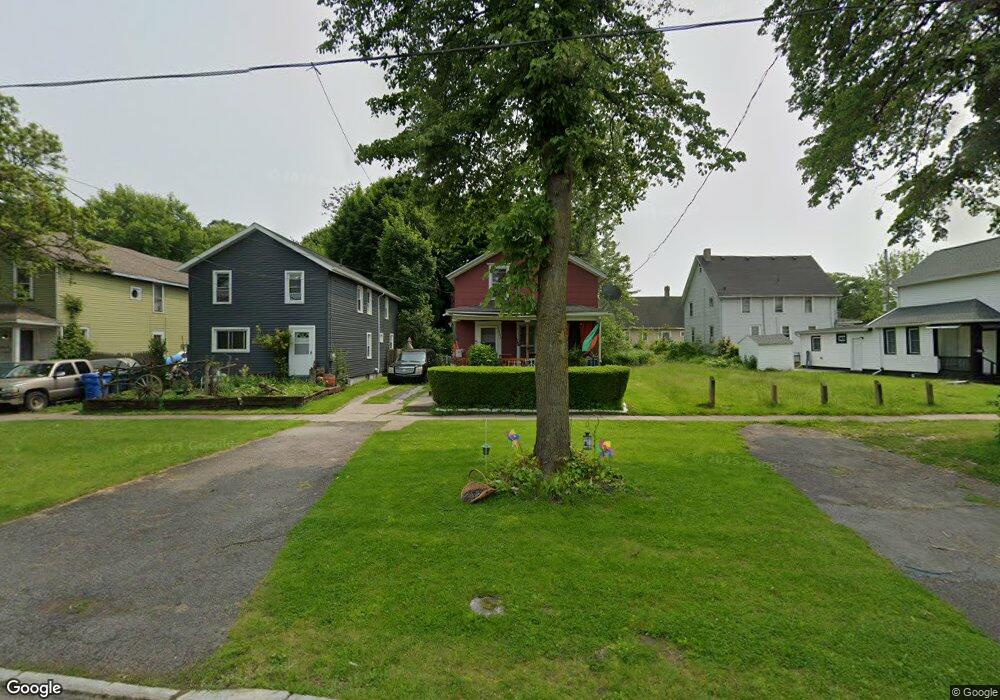
437 Wilder St Rochester, NY 14611
Dutchtown NeighborhoodEstimated Value: $89,743 - $108,000
4
Beds
1
Bath
1,458
Sq Ft
$70/Sq Ft
Est. Value
About This Home
This home is located at 437 Wilder St, Rochester, NY 14611 and is currently estimated at $102,186, approximately $70 per square foot. 437 Wilder St is a home located in Monroe County with nearby schools including Enrico Fermi School No. 17, John Williams School No. 5, and Dr. Louis A. Cerulli School No. 34.
Ownership History
Date
Name
Owned For
Owner Type
Purchase Details
Closed on
Sep 8, 2011
Sold by
Massey Arthur E
Bought by
Horace Annie Mae
Current Estimated Value
Home Financials for this Owner
Home Financials are based on the most recent Mortgage that was taken out on this home.
Original Mortgage
$30,000
Outstanding Balance
$2,553
Interest Rate
3.67%
Mortgage Type
Seller Take Back
Estimated Equity
$99,633
Purchase Details
Closed on
Jun 14, 2001
Sold by
Ella Secash
Bought by
Massey Arthur E
Create a Home Valuation Report for This Property
The Home Valuation Report is an in-depth analysis detailing your home's value as well as a comparison with similar homes in the area
Home Values in the Area
Average Home Value in this Area
Purchase History
| Date | Buyer | Sale Price | Title Company |
|---|---|---|---|
| Horace Annie Mae | $30,000 | None Available | |
| Massey Arthur E | $4,200 | -- |
Source: Public Records
Mortgage History
| Date | Status | Borrower | Loan Amount |
|---|---|---|---|
| Open | Horace Annie Mae | $30,000 |
Source: Public Records
Tax History Compared to Growth
Tax History
| Year | Tax Paid | Tax Assessment Tax Assessment Total Assessment is a certain percentage of the fair market value that is determined by local assessors to be the total taxable value of land and additions on the property. | Land | Improvement |
|---|---|---|---|---|
| 2024 | $392 | $64,700 | $8,300 | $56,400 |
| 2023 | $258 | $26,200 | $4,400 | $21,800 |
| 2022 | $303 | $26,200 | $4,400 | $21,800 |
| 2021 | $509 | $26,200 | $4,400 | $21,800 |
| 2020 | $390 | $26,200 | $4,400 | $21,800 |
| 2019 | $355 | $22,000 | $4,400 | $17,600 |
| 2018 | $0 | $22,000 | $4,400 | $17,600 |
| 2017 | $0 | $22,000 | $4,400 | $17,600 |
| 2016 | $355 | $22,000 | $4,400 | $17,600 |
| 2015 | $794 | $23,000 | $4,400 | $18,600 |
| 2014 | $794 | $23,000 | $4,400 | $18,600 |
Source: Public Records
Map
Nearby Homes