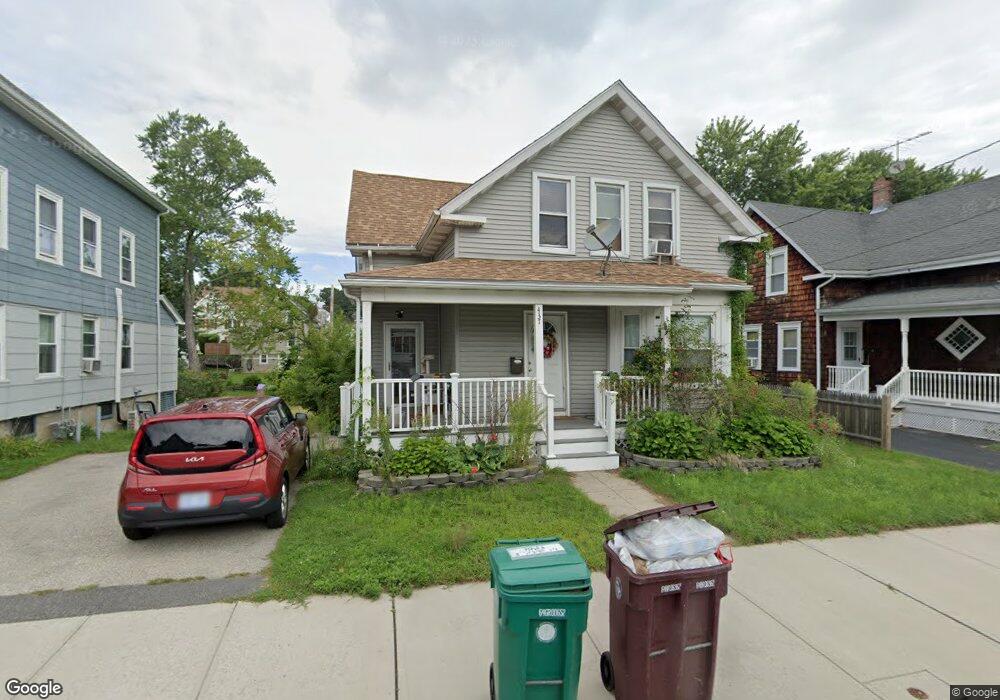
437 Winter St Woonsocket, RI 02895
North End NeighborhoodEstimated Value: $347,000 - $374,000
3
Beds
2
Baths
1,394
Sq Ft
$258/Sq Ft
Est. Value
About This Home
This home is located at 437 Winter St, Woonsocket, RI 02895 and is currently estimated at $359,379, approximately $257 per square foot. 437 Winter St is a home located in Providence County with nearby schools including Woonsocket High School, Rise Prep Mayoral Academy Middle School, and Rise Prep Mayoral Academy.
Ownership History
Date
Name
Owned For
Owner Type
Purchase Details
Closed on
Oct 18, 2010
Sold by
Moran Charles F
Bought by
Khamvongsa Khonmany
Current Estimated Value
Home Financials for this Owner
Home Financials are based on the most recent Mortgage that was taken out on this home.
Original Mortgage
$98,061
Outstanding Balance
$64,489
Interest Rate
4.36%
Mortgage Type
Purchase Money Mortgage
Estimated Equity
$294,890
Create a Home Valuation Report for This Property
The Home Valuation Report is an in-depth analysis detailing your home's value as well as a comparison with similar homes in the area
Home Values in the Area
Average Home Value in this Area
Purchase History
| Date | Buyer | Sale Price | Title Company |
|---|---|---|---|
| Khamvongsa Khonmany | $99,000 | -- | |
| Khamvongsa Khonmany | $99,000 | -- |
Source: Public Records
Mortgage History
| Date | Status | Borrower | Loan Amount |
|---|---|---|---|
| Open | Khamvongsa Khonmany | $98,061 | |
| Closed | Khamvongsa Khonmany | $98,061 |
Source: Public Records
Tax History Compared to Growth
Tax History
| Year | Tax Paid | Tax Assessment Tax Assessment Total Assessment is a certain percentage of the fair market value that is determined by local assessors to be the total taxable value of land and additions on the property. | Land | Improvement |
|---|---|---|---|---|
| 2025 | $3,637 | $323,900 | $87,100 | $236,800 |
| 2024 | $3,568 | $245,400 | $82,700 | $162,700 |
| 2023 | $3,431 | $245,400 | $82,700 | $162,700 |
| 2022 | $3,431 | $245,400 | $82,700 | $162,700 |
| 2021 | $3,591 | $151,200 | $52,000 | $99,200 |
| 2020 | $3,629 | $151,200 | $52,000 | $99,200 |
| 2018 | $3,641 | $151,200 | $52,000 | $99,200 |
| 2017 | $3,329 | $110,600 | $41,400 | $69,200 |
| 2016 | $3,522 | $110,600 | $41,400 | $69,200 |
| 2015 | $4,046 | $110,600 | $41,400 | $69,200 |
| 2014 | $2,699 | $107,300 | $45,500 | $61,800 |
Source: Public Records
Map
Nearby Homes
- 309 Summer St
- 458 Prospect St
- 542 Prospect St
- 589 Gaskill St
- 103 Summer St
- 437 N Main St
- 130 E School St
- 56 Winter St
- 43 Fairway Ln Unit 43
- 187 Boyden St
- 58 Oakley Rd
- 60 Fairlawn Ave
- 341 Blackstone St
- 308 Harris Ave
- 415 Blackstone St
- 10 Huntington Ave
- 151 Church St Unit 1
- 74 Highland St
- 0 N Main St Unit 1401765
- 115 Railroad St