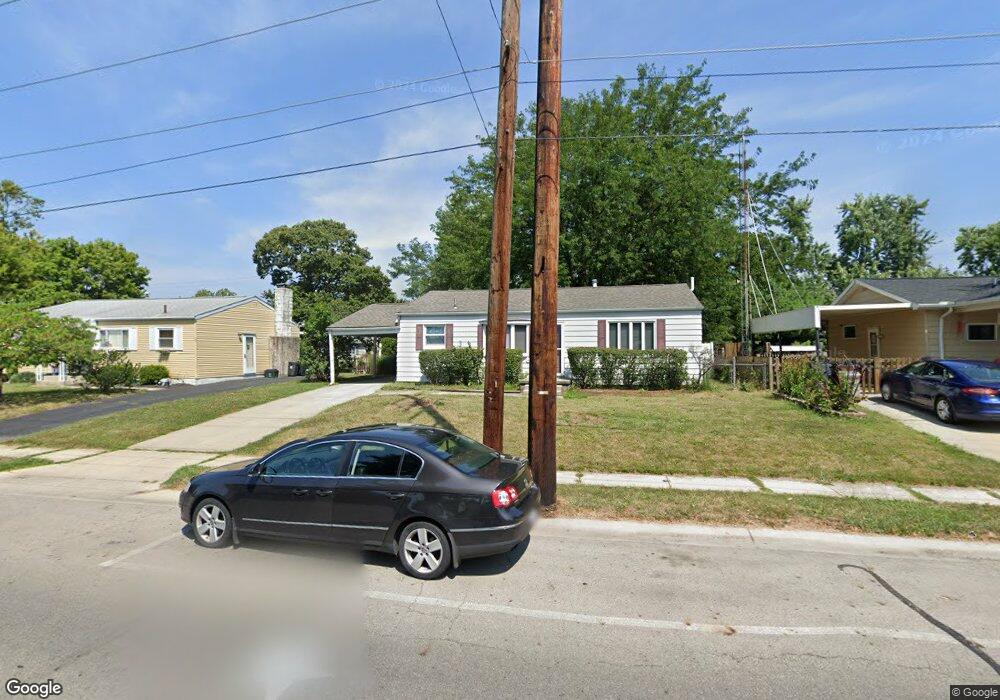
4370 Etna Rd Columbus, OH 43213
Estimated Value: $181,000 - $235,000
3
Beds
2
Baths
1,014
Sq Ft
$195/Sq Ft
Est. Value
About This Home
This home is located at 4370 Etna Rd, Columbus, OH 43213 and is currently estimated at $198,093, approximately $195 per square foot. 4370 Etna Rd is a home located in Franklin County with nearby schools including Etna Road Elementary School, Beechwood Elementary School, and Rosemore Middle School.
Ownership History
Date
Name
Owned For
Owner Type
Purchase Details
Closed on
Oct 13, 2020
Sold by
Ledbetter Tabetha L and Adkins Tabetha L
Bought by
Cartwright Verline
Current Estimated Value
Purchase Details
Closed on
Oct 14, 2010
Sold by
Adkins Tabetha L and Adkins Todd C
Bought by
Cartwright Verline
Home Financials for this Owner
Home Financials are based on the most recent Mortgage that was taken out on this home.
Original Mortgage
$112,485
Interest Rate
4.5%
Mortgage Type
FHA
Purchase Details
Closed on
Aug 12, 2005
Sold by
Dingess Garfield and Dingess Candace Lee
Bought by
Ledbetter Tabetha L
Home Financials for this Owner
Home Financials are based on the most recent Mortgage that was taken out on this home.
Original Mortgage
$90,675
Interest Rate
5.8%
Mortgage Type
Fannie Mae Freddie Mac
Purchase Details
Closed on
Sep 26, 1984
Bought by
Garfield Dingess
Create a Home Valuation Report for This Property
The Home Valuation Report is an in-depth analysis detailing your home's value as well as a comparison with similar homes in the area
Home Values in the Area
Average Home Value in this Area
Purchase History
| Date | Buyer | Sale Price | Title Company |
|---|---|---|---|
| Cartwright Verline | $114,000 | Ameri Title | |
| Cartwright Verline | $114,000 | Amerititle | |
| Ledbetter Tabetha L | $96,000 | Amerititle | |
| Garfield Dingess | $37,000 | -- |
Source: Public Records
Mortgage History
| Date | Status | Borrower | Loan Amount |
|---|---|---|---|
| Previous Owner | Cartwright Verline | $112,485 | |
| Previous Owner | Ledbetter Tabetha L | $90,675 |
Source: Public Records
Tax History Compared to Growth
Tax History
| Year | Tax Paid | Tax Assessment Tax Assessment Total Assessment is a certain percentage of the fair market value that is determined by local assessors to be the total taxable value of land and additions on the property. | Land | Improvement |
|---|---|---|---|---|
| 2024 | $2,444 | $65,700 | $14,770 | $50,930 |
| 2023 | $2,454 | $65,695 | $14,770 | $50,925 |
| 2022 | $1,699 | $38,500 | $6,650 | $31,850 |
| 2021 | $1,595 | $38,500 | $6,650 | $31,850 |
| 2020 | $1,580 | $38,500 | $6,650 | $31,850 |
| 2019 | $1,332 | $30,560 | $5,320 | $25,240 |
| 2018 | $1,418 | $30,560 | $5,320 | $25,240 |
| 2017 | $1,287 | $30,560 | $5,320 | $25,240 |
| 2016 | $1,466 | $31,190 | $5,390 | $25,800 |
| 2015 | $1,478 | $31,190 | $5,390 | $25,800 |
| 2014 | $1,478 | $31,190 | $5,390 | $25,800 |
| 2013 | $812 | $34,650 | $5,985 | $28,665 |
Source: Public Records
Map
Nearby Homes
- 579 Westphal Ave
- 451 Beaver Ave
- 4368 Broadhurst Dr
- 4489 Saint Margaret Ln
- 4148 Elbern Ave
- 571 S Hamilton Rd
- 4232 Mayflower Blvd
- 4653 Kae Ave
- 798 S Yearling Rd
- 4572 Saint Anthony Ln
- 4662 Jae Ave
- 353 Shell Ct E
- 469 Cumberland Dr
- 4780 Etna Rd Unit 782
- 4094 E Main St
- 424 Cumberland Dr
- 963 Erickson Ave
- 4144 Mcallister Ave
- 1085 S Hamilton Rd
- 3814 Elbern Ave