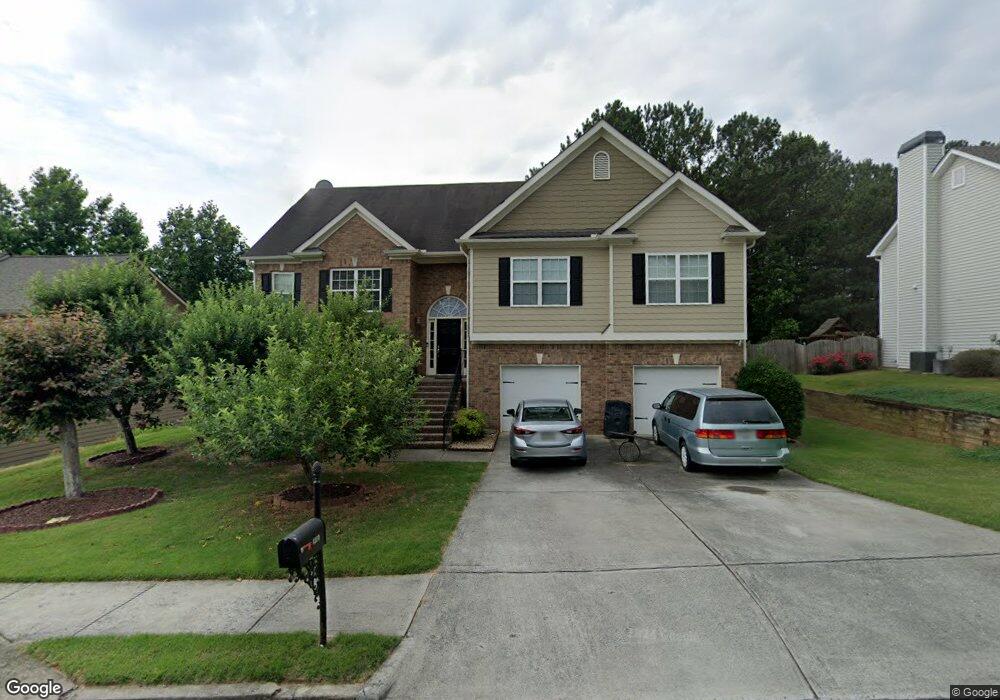
4370 Mulberry Ridge Ln Unit 1 Hoschton, GA 30548
Estimated Value: $445,000 - $481,000
3
Beds
3
Baths
1,939
Sq Ft
$236/Sq Ft
Est. Value
About This Home
This home is located at 4370 Mulberry Ridge Ln Unit 1, Hoschton, GA 30548 and is currently estimated at $458,526, approximately $236 per square foot. 4370 Mulberry Ridge Ln Unit 1 is a home located in Gwinnett County with nearby schools including Duncan Creek Elementary School, Frank N. Osborne Middle School, and Mill Creek High School.
Ownership History
Date
Name
Owned For
Owner Type
Purchase Details
Closed on
May 9, 2006
Sold by
Jim Huff Corp
Bought by
Pustea Marcel S
Current Estimated Value
Home Financials for this Owner
Home Financials are based on the most recent Mortgage that was taken out on this home.
Original Mortgage
$171,100
Outstanding Balance
$99,320
Interest Rate
6.44%
Mortgage Type
New Conventional
Estimated Equity
$359,206
Purchase Details
Closed on
May 5, 2006
Sold by
Bey Ayesha L
Bought by
Jim Huff Corp
Home Financials for this Owner
Home Financials are based on the most recent Mortgage that was taken out on this home.
Original Mortgage
$171,100
Outstanding Balance
$99,320
Interest Rate
6.44%
Mortgage Type
New Conventional
Estimated Equity
$359,206
Purchase Details
Closed on
Sep 29, 2005
Sold by
Jim Huff Corp
Bought by
Bey Ayesha L
Home Financials for this Owner
Home Financials are based on the most recent Mortgage that was taken out on this home.
Original Mortgage
$159,120
Interest Rate
6.92%
Mortgage Type
New Conventional
Create a Home Valuation Report for This Property
The Home Valuation Report is an in-depth analysis detailing your home's value as well as a comparison with similar homes in the area
Home Values in the Area
Average Home Value in this Area
Purchase History
| Date | Buyer | Sale Price | Title Company |
|---|---|---|---|
| Pustea Marcel S | $213,900 | -- | |
| Jim Huff Corp | -- | -- | |
| Bey Ayesha L | $198,900 | -- |
Source: Public Records
Mortgage History
| Date | Status | Borrower | Loan Amount |
|---|---|---|---|
| Open | Pustea Marcel S | $171,100 | |
| Closed | Jim Huff Corp | $21,350 | |
| Previous Owner | Bey Ayesha L | $159,120 |
Source: Public Records
Tax History Compared to Growth
Tax History
| Year | Tax Paid | Tax Assessment Tax Assessment Total Assessment is a certain percentage of the fair market value that is determined by local assessors to be the total taxable value of land and additions on the property. | Land | Improvement |
|---|---|---|---|---|
| 2024 | $4,946 | $173,160 | $32,000 | $141,160 |
| 2023 | $4,946 | $173,160 | $32,000 | $141,160 |
| 2022 | $3,653 | $112,160 | $21,280 | $90,880 |
| 2021 | $3,707 | $112,160 | $21,280 | $90,880 |
| 2020 | $3,555 | $103,960 | $20,160 | $83,800 |
| 2019 | $3,448 | $103,960 | $20,160 | $83,800 |
| 2018 | $3,148 | $89,960 | $15,600 | $74,360 |
| 2016 | $2,998 | $82,120 | $15,600 | $66,520 |
| 2015 | $2,624 | $70,400 | $12,000 | $58,400 |
| 2014 | -- | $68,400 | $12,000 | $56,400 |
Source: Public Records
Map
Nearby Homes
- 4415 Mulberry Ridge Ln Unit 1
- 1785 Dartford Way
- 1661 Silver Crest Way
- 4539 Braselton Hwy
- 0 Georgia 124 Unit 10590221
- 4420 Elvie Way
- 1682 Mineral Springs Rd
- 4335 Braselton Hwy Unit tax parcel R3003 327
- 4335 Magpie Dr
- 1480 Smoke Hill Dr
- 1560 Turtle Pond Dr
- 2088 Skybrooke Ct
- 1874 Granite Hill Ct
- 4212 Gold Springs Ln
- 4777 Waxwing St
- 2013 Skybrooke Ln
- 1330 Smoke Hill Dr
- 1894 Gray Gables Way
- 4380 Mulberry Ridge Ln
- 4380 Mulberry Ridge Ln Unit 1
- 4360 Mulberry Ridge Ln Unit 1
- 4350 Mulberry Ridge Ln
- 4375 Mulberry Ridge Ln
- 4375 Mulberry Ridge Ln NE
- 4385 Mulberry Ridge Ln
- 4470 Mulberry Ridge Ln
- 4355 Mulberry Ridge Ln Unit 1
- 4460 Mulberry Ridge Ln Unit 1
- 4460 Mulberry Ridge Ln
- 4480 Mulberry Ridge Ln
- 4340 Mulberry Ridge Ln
- 4395 Mulberry Ridge Ln
- 4450 Mulberry Ridge Ln
- 4450 Mulberry Ridge Ln
- 4345 Mulberry Ridge Ln
- 4405 Mulberry Ridge Ln
- 0 Mulberry Ridge Ln NE Unit 8672155
- 0 Mulberry Ridge Ln NE Unit 8566115