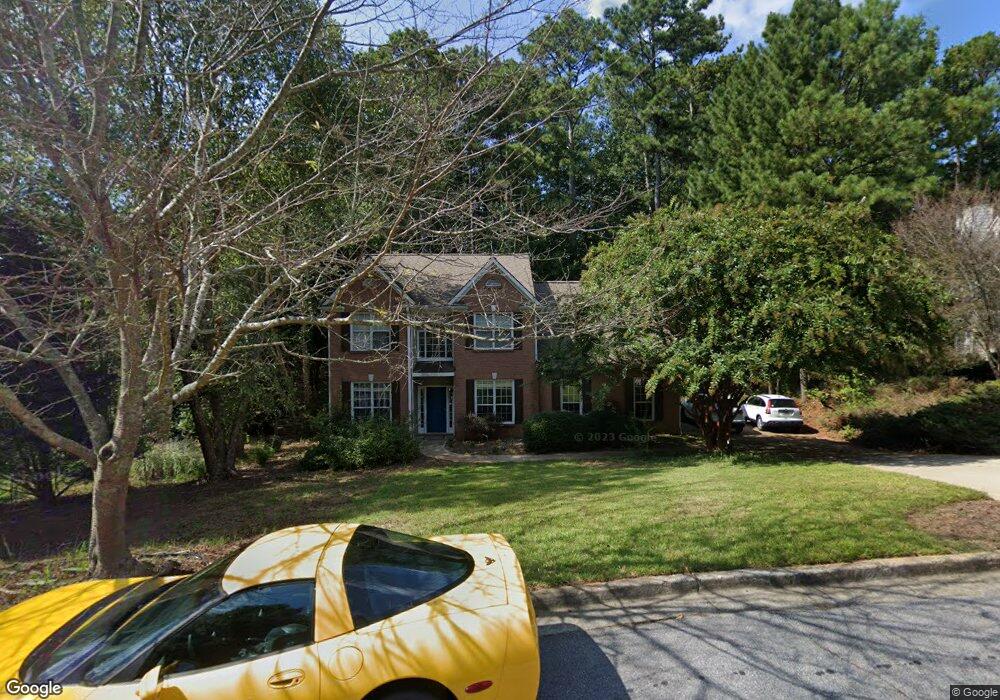
4370 Red Rock Point Unit 4 Suwanee, GA 30024
Estimated Value: $517,124 - $533,000
4
Beds
3
Baths
1,998
Sq Ft
$262/Sq Ft
Est. Value
About This Home
This home is located at 4370 Red Rock Point Unit 4, Suwanee, GA 30024 and is currently estimated at $524,031, approximately $262 per square foot. 4370 Red Rock Point Unit 4 is a home located in Gwinnett County with nearby schools including Level Creek Elementary School, North Gwinnett Middle School, and North Gwinnett High School.
Ownership History
Date
Name
Owned For
Owner Type
Purchase Details
Closed on
Apr 25, 2013
Sold by
Danner K Rory
Bought by
Danner Elaine
Current Estimated Value
Home Financials for this Owner
Home Financials are based on the most recent Mortgage that was taken out on this home.
Original Mortgage
$173,000
Outstanding Balance
$118,226
Interest Rate
2.78%
Mortgage Type
New Conventional
Estimated Equity
$405,805
Purchase Details
Closed on
Dec 30, 1999
Sold by
Narducci David S
Bought by
Danner Danner K and Danner Elaine
Home Financials for this Owner
Home Financials are based on the most recent Mortgage that was taken out on this home.
Original Mortgage
$170,340
Interest Rate
7.8%
Mortgage Type
VA
Purchase Details
Closed on
Aug 27, 1998
Sold by
Bowen Bldrs Group
Bought by
Narducci David S
Home Financials for this Owner
Home Financials are based on the most recent Mortgage that was taken out on this home.
Original Mortgage
$136,300
Interest Rate
6.95%
Mortgage Type
New Conventional
Create a Home Valuation Report for This Property
The Home Valuation Report is an in-depth analysis detailing your home's value as well as a comparison with similar homes in the area
Home Values in the Area
Average Home Value in this Area
Purchase History
| Date | Buyer | Sale Price | Title Company |
|---|---|---|---|
| Danner Elaine | -- | -- | |
| Danner Danner K | $167,000 | -- | |
| Narducci David S | $143,500 | -- |
Source: Public Records
Mortgage History
| Date | Status | Borrower | Loan Amount |
|---|---|---|---|
| Open | Danner Elaine | $173,000 | |
| Previous Owner | Danner Danner K | $170,340 | |
| Previous Owner | Narducci David S | $136,300 |
Source: Public Records
Tax History Compared to Growth
Tax History
| Year | Tax Paid | Tax Assessment Tax Assessment Total Assessment is a certain percentage of the fair market value that is determined by local assessors to be the total taxable value of land and additions on the property. | Land | Improvement |
|---|---|---|---|---|
| 2024 | $3,952 | $169,720 | $39,200 | $130,520 |
| 2023 | $3,952 | $169,720 | $39,200 | $130,520 |
| 2022 | $4,533 | $155,600 | $39,200 | $116,400 |
| 2021 | $3,618 | $120,080 | $29,440 | $90,640 |
| 2020 | $3,435 | $112,080 | $29,440 | $82,640 |
| 2019 | $2,865 | $111,440 | $35,600 | $75,840 |
| 2018 | $2,881 | $111,440 | $35,600 | $75,840 |
| 2016 | $2,666 | $101,280 | $32,400 | $68,880 |
| 2015 | $2,422 | $89,040 | $27,000 | $62,040 |
| 2014 | -- | $89,040 | $27,000 | $62,040 |
Source: Public Records
Map
Nearby Homes
- 858 Red Rock Ct
- 4282 Goldfield Trace Unit 4
- 4339 Lansfaire Terrace Unit 4
- 1116 Bartlett Trace
- 4544 Silver Peak Pkwy
- 837 Village Manor Place
- 755 Amberton Close Unit 2
- 735 Amberton Close
- 4335 Landover Way Unit 3
- 4265 Lansmoore Crossing
- 1350 Peachtree Industrial Blvd
- 1011 Crofton Landing Unit 1
- 655 Grove Manor Ct
- 4569 Campenille Trace
- 1199 Bennett Creek Overlook
- 1179 Bennett Creek Overlook
- 1119 Bennett Creek Overlook
- 1309 Bennett Creek Overlook
- 4370 Red Rock Point Unit 77
- 4370 Red Rock Point
- 4380 Red Rock Point
- 863 Red Rock Ct Unit 4
- 853 Red Rock Ct
- 873 Red Rock Ct
- 4390 Red Rock Point
- 4384 Aldenham Way
- 4374 Aldenham Way Unit 5
- 4394 Aldenham Way
- 4384 Aldenham Way NW
- 4375 Red Rock Point
- 0 Red Rock Ct Unit 7545209
- 0 Red Rock Ct Unit 8672782
- 0 Red Rock Ct Unit 8756468
- 0 Red Rock Ct Unit 8782170
- 0 Red Rock Ct Unit 8941683
- 0 Red Rock Point Unit 7031988
- 0 Red Rock Point Unit 7463420
- 0 Red Rock Point Unit 7428836