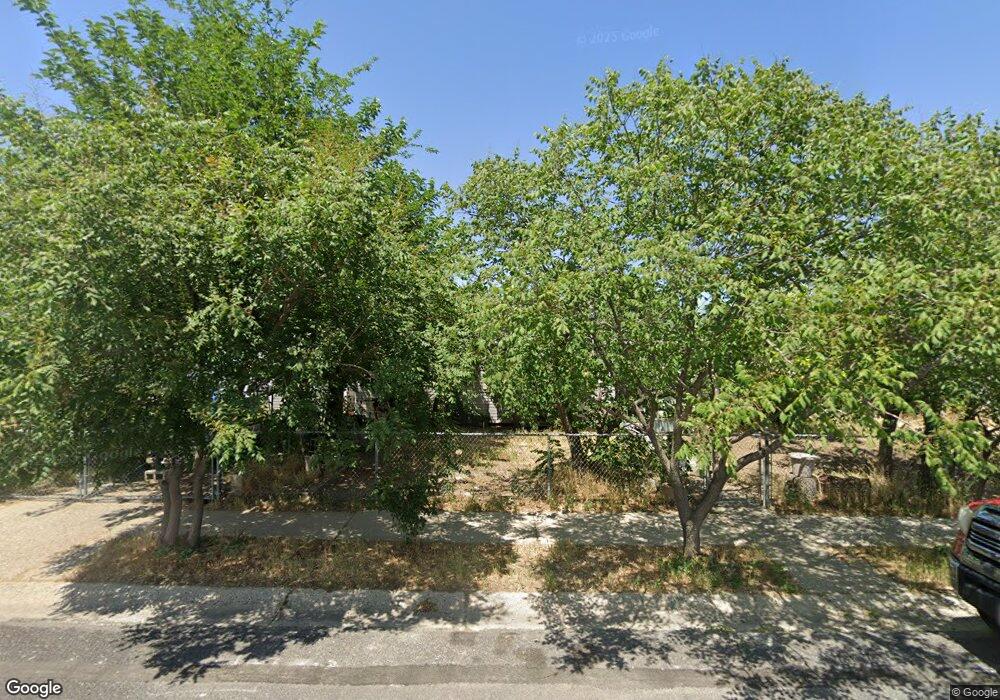
4370 W 4865 S Salt Lake City, UT 84118
Estimated Value: $393,000 - $409,000
3
Beds
2
Baths
1,440
Sq Ft
$279/Sq Ft
Est. Value
About This Home
This home is located at 4370 W 4865 S, Salt Lake City, UT 84118 and is currently estimated at $402,336, approximately $279 per square foot. 4370 W 4865 S is a home located in Salt Lake County with nearby schools including David Gourley Elementary School, Kearns Jr High School, and Kearns High School.
Ownership History
Date
Name
Owned For
Owner Type
Purchase Details
Closed on
Feb 1, 2023
Sold by
Nichols William Howard
Bought by
Nichols Robert John
Current Estimated Value
Purchase Details
Closed on
Feb 17, 2004
Sold by
Nichols William H
Bought by
Nichols William H
Purchase Details
Closed on
Sep 13, 1996
Sold by
Nichols William H and Nichols Korlee M
Bought by
Nichols William H
Home Financials for this Owner
Home Financials are based on the most recent Mortgage that was taken out on this home.
Original Mortgage
$25,000
Interest Rate
7.38%
Create a Home Valuation Report for This Property
The Home Valuation Report is an in-depth analysis detailing your home's value as well as a comparison with similar homes in the area
Home Values in the Area
Average Home Value in this Area
Purchase History
| Date | Buyer | Sale Price | Title Company |
|---|---|---|---|
| Nichols Robert John | -- | -- | |
| Nichols William H | -- | Backman Stewart Title Svcs | |
| Nichols William H | -- | -- |
Source: Public Records
Mortgage History
| Date | Status | Borrower | Loan Amount |
|---|---|---|---|
| Previous Owner | Nichols William H | $25,000 |
Source: Public Records
Tax History Compared to Growth
Tax History
| Year | Tax Paid | Tax Assessment Tax Assessment Total Assessment is a certain percentage of the fair market value that is determined by local assessors to be the total taxable value of land and additions on the property. | Land | Improvement |
|---|---|---|---|---|
| 2025 | $2,547 | $364,400 | $83,700 | $280,700 |
| 2024 | $2,547 | $342,900 | $78,700 | $264,200 |
| 2023 | $2,375 | $307,100 | $75,600 | $231,500 |
| 2022 | $2,499 | $324,400 | $74,200 | $250,200 |
| 2021 | $2,216 | $266,500 | $57,100 | $209,400 |
| 2020 | $1,860 | $209,000 | $52,000 | $157,000 |
| 2019 | $1,858 | $206,500 | $49,000 | $157,500 |
| 2018 | $1,822 | $195,500 | $49,000 | $146,500 |
| 2017 | $1,497 | $168,100 | $49,000 | $119,100 |
| 2016 | $1,239 | $139,400 | $45,200 | $94,200 |
| 2015 | $1,122 | $117,500 | $58,000 | $59,500 |
| 2014 | $1,044 | $107,000 | $53,900 | $53,100 |
Source: Public Records
Map
Nearby Homes