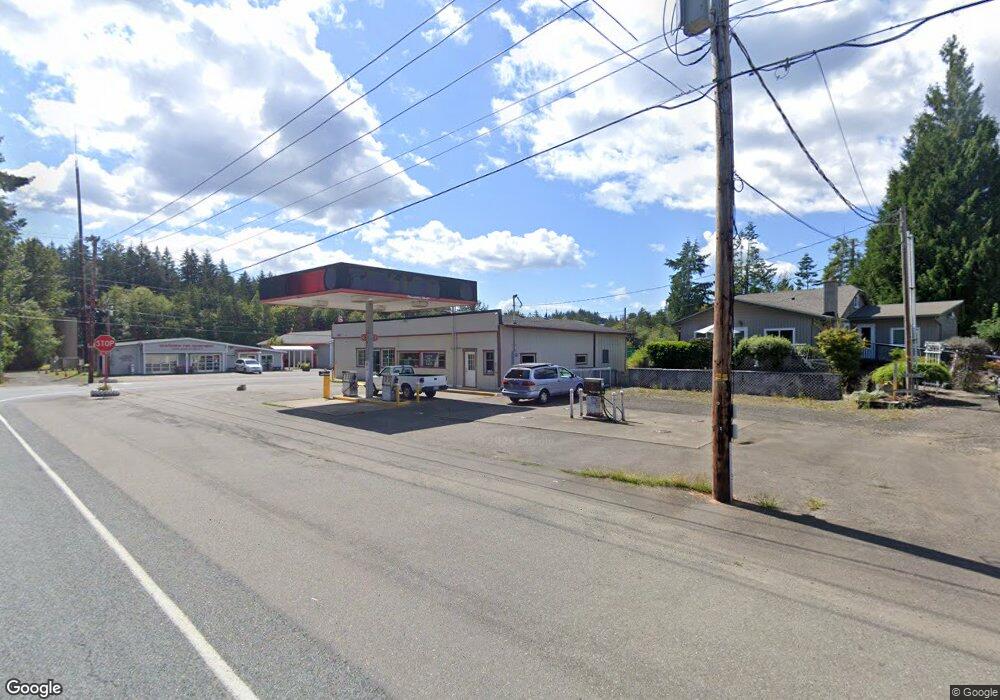
4371 E Grapeview Loop Rd Grapeview, WA 98546
Estimated Value: $405,846
Studio
--
Bath
1,924
Sq Ft
$211/Sq Ft
Est. Value
About This Home
This home is located at 4371 E Grapeview Loop Rd, Grapeview, WA 98546 and is currently estimated at $405,846, approximately $210 per square foot. 4371 E Grapeview Loop Rd is a home located in Mason County with nearby schools including Grapeview Elementary/Middle School.
Ownership History
Date
Name
Owned For
Owner Type
Purchase Details
Closed on
Nov 20, 2017
Sold by
Maynard Misko and Maynard John
Bought by
Five Star Investment Group Llc
Current Estimated Value
Purchase Details
Closed on
Nov 17, 2017
Sold by
Maynard Misko and Maynard John
Bought by
Five Star Investment Group Llc
Purchase Details
Closed on
Jul 21, 2008
Sold by
Five Star Investment Group Llc
Bought by
Maynerd Misko
Home Financials for this Owner
Home Financials are based on the most recent Mortgage that was taken out on this home.
Original Mortgage
$165,000
Interest Rate
6.41%
Mortgage Type
Commercial
Purchase Details
Closed on
Aug 29, 2006
Sold by
H Moore And Associates Llc
Bought by
Five Star Investment Group Llc
Purchase Details
Closed on
Jan 19, 2005
Sold by
Crowley William J
Bought by
H Moore And Associates Llc
Create a Home Valuation Report for This Property
The Home Valuation Report is an in-depth analysis detailing your home's value as well as a comparison with similar homes in the area
Purchase History
| Date | Buyer | Sale Price | Title Company |
|---|---|---|---|
| Five Star Investment Group Llc | -- | Mason County Title | |
| Five Star Investment Group Llc | -- | Mason County Title | |
| Maynerd Misko | $190,000 | Mason County Title Ins Co | |
| Five Star Investment Group Llc | $100,000 | Mason County Title Ins Co | |
| H Moore And Associates Llc | -- | First American Title |
Source: Public Records
Mortgage History
| Date | Status | Borrower | Loan Amount |
|---|---|---|---|
| Previous Owner | Maynerd Misko | $165,000 |
Source: Public Records
Tax History
| Year | Tax Paid | Tax Assessment Tax Assessment Total Assessment is a certain percentage of the fair market value that is determined by local assessors to be the total taxable value of land and additions on the property. | Land | Improvement |
|---|---|---|---|---|
| 2025 | $3,111 | $427,650 | $99,660 | $327,990 |
| 2023 | $3,111 | $379,520 | $98,170 | $281,350 |
| 2022 | $3,088 | $352,225 | $94,745 | $257,480 |
| 2021 | $2,589 | $352,225 | $94,745 | $257,480 |
| 2020 | $2,285 | $293,750 | $72,880 | $220,870 |
| 2018 | $2,112 | $194,920 | $55,450 | $139,470 |
| 2017 | $1,621 | $194,815 | $55,345 | $139,470 |
| 2016 | $1,656 | $159,010 | $52,710 | $106,300 |
| 2015 | $1,745 | $162,125 | $73,125 | $89,000 |
| 2014 | -- | $164,185 | $65,395 | $98,790 |
| 2013 | -- | $149,930 | $56,480 | $93,450 |
Source: Public Records
Map
Nearby Homes
- 101 E Pirates Place
- 90 E Treasure Island Dr
- 5440 E Grapeview Loop Rd
- 0 E Murray Rd N Unit NWM2467437
- 310 E Rauschert Rd
- 7504 Crescent Beach Rd NW
- 6206 Crescent Beach Rd NW
- 432 E Pointes Dr E
- 148 E Fox Run Ln
- 7104 E Grapeview Loop Rd
- 758 E Promontory Rd
- 625 E Pointes Dr W
- 664 E Portage Rd
- 741 E Promontory Rd
- 7360 E Grapeview Loop Rd
- 731 E Promontory Rd
- 713 E Pointes Dr W
- 301 E Pointes Dr E
- 17717 E State Route 3
- 116th 166th St NW
- 4381 E Grapeview Loop Rd
- 4371 E Grapeview Loop Rd
- 4281 E Grapeview Loop Rd
- 4441 E Grapeview Loop Rd
- 4360 E Grapeview Loop Rd
- 0 Tr4 of Govt Lot 1 Grapeview Lp Unit 1938695
- 4368 E Grapeview Loop Rd
- 4443 E Grapeview Loop Rd
- 4362 E Grapeview Loop Rd
- 4364 E Grapeview Loop Rd
- 61 E Okonek Rd
- 4201 E Grapeview Loop Rd
- 71 Okonek Rd
- 73 E Okonek Rd
- 4452 E Grapeview Loop Rd
- 121 E Jack Powell Loop
- 0 Okonek Rd
- 0 O Okonek Rd
- 4450 E Grapeview Loop Rd
- 4490 E Grapeview Lp Loop
Your Personal Tour Guide
Ask me questions while you tour the home.