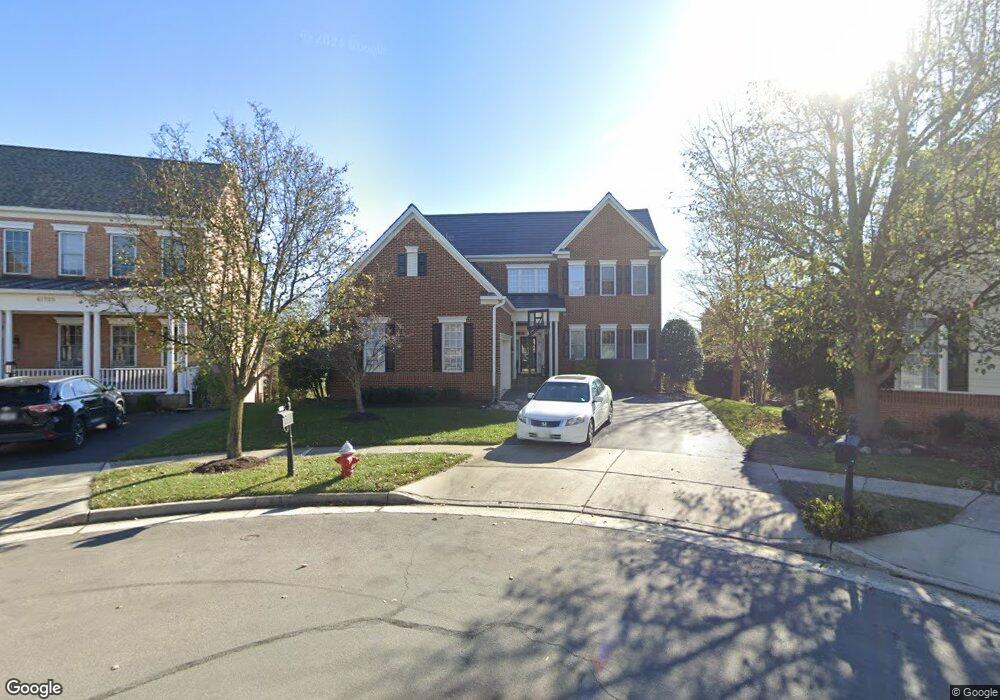
43721 Collett Mill Ct Leesburg, VA 20176
Estimated Value: $1,189,000 - $1,246,000
5
Beds
5
Baths
4,390
Sq Ft
$276/Sq Ft
Est. Value
About This Home
This home is located at 43721 Collett Mill Ct, Leesburg, VA 20176 and is currently estimated at $1,210,629, approximately $275 per square foot. 43721 Collett Mill Ct is a home located in Loudoun County with nearby schools including Steuart W. Weller Elementary School, Belmont Ridge Middle, and Riverside High.
Ownership History
Date
Name
Owned For
Owner Type
Purchase Details
Closed on
Apr 30, 2008
Sold by
Heskett Todd E
Bought by
Trautman Eric T
Current Estimated Value
Home Financials for this Owner
Home Financials are based on the most recent Mortgage that was taken out on this home.
Original Mortgage
$543,000
Outstanding Balance
$345,853
Interest Rate
5.99%
Mortgage Type
New Conventional
Estimated Equity
$864,776
Purchase Details
Closed on
Feb 17, 2005
Sold by
Basseer Potkin
Bought by
Heskett Todd E
Home Financials for this Owner
Home Financials are based on the most recent Mortgage that was taken out on this home.
Original Mortgage
$620,000
Interest Rate
5.78%
Mortgage Type
New Conventional
Purchase Details
Closed on
Feb 3, 2003
Sold by
B L Homes Lansdowne
Bought by
Basseer Potkin
Home Financials for this Owner
Home Financials are based on the most recent Mortgage that was taken out on this home.
Original Mortgage
$462,102
Interest Rate
6.09%
Mortgage Type
New Conventional
Create a Home Valuation Report for This Property
The Home Valuation Report is an in-depth analysis detailing your home's value as well as a comparison with similar homes in the area
Home Values in the Area
Average Home Value in this Area
Purchase History
| Date | Buyer | Sale Price | Title Company |
|---|---|---|---|
| Trautman Eric T | $679,000 | -- | |
| Heskett Todd E | $775,000 | -- | |
| Basseer Potkin | $577,628 | -- |
Source: Public Records
Mortgage History
| Date | Status | Borrower | Loan Amount |
|---|---|---|---|
| Open | Trautman Eric T | $543,000 | |
| Previous Owner | Heskett Todd E | $620,000 | |
| Previous Owner | Basseer Potkin | $462,102 |
Source: Public Records
Tax History Compared to Growth
Tax History
| Year | Tax Paid | Tax Assessment Tax Assessment Total Assessment is a certain percentage of the fair market value that is determined by local assessors to be the total taxable value of land and additions on the property. | Land | Improvement |
|---|---|---|---|---|
| 2025 | $8,777 | $1,090,270 | $339,100 | $751,170 |
| 2024 | $8,664 | $1,001,640 | $299,100 | $702,540 |
| 2023 | $7,712 | $924,530 | $299,100 | $625,430 |
| 2022 | $7,231 | $855,540 | $259,100 | $596,440 |
| 2021 | $7,279 | $742,720 | $229,100 | $513,620 |
| 2020 | $7,202 | $695,860 | $229,100 | $466,760 |
| 2019 | $7,181 | $687,170 | $229,100 | $458,070 |
| 2018 | $7,236 | $666,930 | $229,100 | $437,830 |
| 2017 | $7,197 | $639,690 | $229,100 | $410,590 |
| 2016 | $7,247 | $632,890 | $0 | $0 |
| 2015 | $7,578 | $438,560 | $0 | $438,560 |
| 2014 | $7,481 | $438,580 | $0 | $438,580 |
Source: Public Records
Map
Nearby Homes
- 19296 Creek Field Cir
- 43843 Kittiwake Dr
- 19162 Coton Hall St
- 19408 Susquehanna Square
- 43643 Mcdowell Square
- 19272 Koslowski Square
- 19264 Koslowski Square
- 43613 Mcdowell Square
- 43595 Mcdowell Square
- 19293 Harlow Square
- 19121 Eagle Mine Terrace
- 19111 Chartier Dr
- 43915 Kittiwake Dr
- 19441 Promenade Dr
- 43802 Lees Mill Square
- 19450 Diamond Lake Dr
- 43656 Riverpoint Dr
- 19176 Sweig Terrace
- 19060 Arroyo Terrace
- 19057 Amur Ct
- 43725 Collett Mill Ct
- 43717 Collett Mill Ct
- 43729 Collett Mill Ct
- 43716 Collett Mill Ct
- 43720 Collett Mill Ct
- 19219 Chartier Dr
- 19223 Chartier Dr
- 43724 Collett Mill Ct
- 19215 Chartier Dr
- 19227 Chartier Dr
- 43728 Collett Mill Ct
- 43741 Collett Mill Ct
- 19231 Chartier Dr
- 43705 Red House Dr
- 43701 Red House Dr
- 43709 Red House Dr
- 43713 Red House Dr
- 43697 Red House Dr
- 43736 Collett Mill Ct
- 43717 Red House Dr