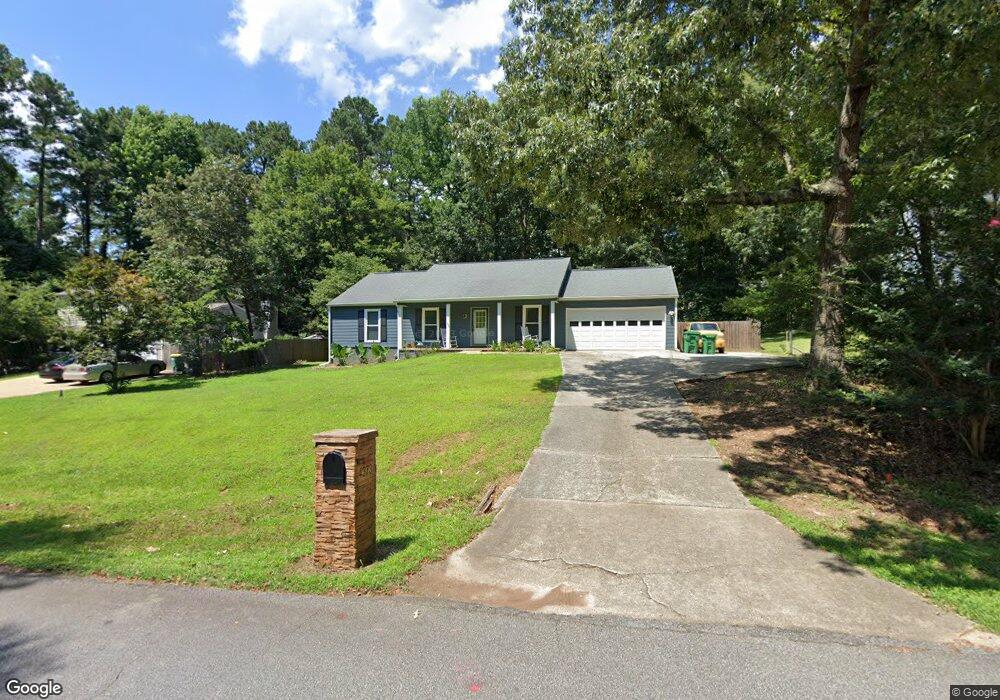
4373 Fitzpatrick Way Unit 2 Norcross, GA 30092
Estimated Value: $407,589 - $542,000
3
Beds
2
Baths
1,408
Sq Ft
$329/Sq Ft
Est. Value
About This Home
This home is located at 4373 Fitzpatrick Way Unit 2, Norcross, GA 30092 and is currently estimated at $462,897, approximately $328 per square foot. 4373 Fitzpatrick Way Unit 2 is a home located in Gwinnett County with nearby schools including Simpson Elementary School, Pinckneyville Middle School, and Norcross High School.
Ownership History
Date
Name
Owned For
Owner Type
Purchase Details
Closed on
Jul 28, 2000
Sold by
Harrelson Richard D and Harrelson Terri M
Bought by
Mcdonald James R
Current Estimated Value
Home Financials for this Owner
Home Financials are based on the most recent Mortgage that was taken out on this home.
Original Mortgage
$130,400
Outstanding Balance
$46,004
Interest Rate
8.23%
Mortgage Type
New Conventional
Estimated Equity
$416,893
Purchase Details
Closed on
Dec 30, 1999
Sold by
Duncan Phillip C
Bought by
Harrelson Richard D and Harrelson Terri M
Home Financials for this Owner
Home Financials are based on the most recent Mortgage that was taken out on this home.
Original Mortgage
$154,346
Interest Rate
7.88%
Mortgage Type
FHA
Create a Home Valuation Report for This Property
The Home Valuation Report is an in-depth analysis detailing your home's value as well as a comparison with similar homes in the area
Home Values in the Area
Average Home Value in this Area
Purchase History
| Date | Buyer | Sale Price | Title Company |
|---|---|---|---|
| Mcdonald James R | $163,000 | -- | |
| Harrelson Richard D | $155,000 | -- | |
| Duncan Phillip C | -- | -- |
Source: Public Records
Mortgage History
| Date | Status | Borrower | Loan Amount |
|---|---|---|---|
| Open | Mcdonald James R | $130,400 | |
| Previous Owner | Duncan Phillip C | $154,346 |
Source: Public Records
Tax History Compared to Growth
Tax History
| Year | Tax Paid | Tax Assessment Tax Assessment Total Assessment is a certain percentage of the fair market value that is determined by local assessors to be the total taxable value of land and additions on the property. | Land | Improvement |
|---|---|---|---|---|
| 2025 | $957 | $186,640 | $38,000 | $148,640 |
| 2024 | $932 | $115,440 | $32,800 | $82,640 |
| 2023 | $932 | $115,440 | $32,800 | $82,640 |
| 2022 | $3,259 | $126,840 | $32,800 | $94,040 |
| 2021 | $2,305 | $67,360 | $26,000 | $41,360 |
| 2020 | $2,316 | $67,360 | $26,000 | $41,360 |
| 2019 | $2,252 | $109,520 | $26,000 | $83,520 |
| 2018 | $2,256 | $67,360 | $24,000 | $43,360 |
| 2016 | $2,209 | $66,912 | $20,400 | $46,512 |
| 2015 | $2,488 | $78,720 | $24,000 | $54,720 |
| 2014 | $2,307 | $76,280 | $24,000 | $52,280 |
Source: Public Records
Map
Nearby Homes
- 5465 Fort Fisher Way
- 5465 Fort Fisher Way
- 5221 W Jones Bridge Rd
- 5397 Valley Mist Ct
- 5665 Creekside Ct
- 5305 Linnadine Way
- 5885 Match Point
- 5809 Alvaton Ct
- The Adams Plan at Waterside - Condos
- 4457 Watervale Way Unit 292
- 4477 Watervale Way Unit 286
- 5047 Shirley Oaks Dr Unit 313
- The Olmstead II Plan at Waterside - Single Family
- The Stanley Plan at Waterside - Single Family
- The Stafford Plan at Waterside - Single Family
- 5039 Shirley Oaks Dr Unit 315
- 4479 Watervale Way Unit 285
- The Barrett II Plan at Waterside - Condos
- The Benton II Plan at Waterside - Townhomes
- The Oakhurst II Plan at Waterside - Single Family
- 4383 Fitzpatrick Way
- 4363 Fitzpatrick Way
- 5518 Patrick Ct
- 5528 Patrick Ct Unit 3
- 4393 Fitzpatrick Way
- 5551 Knox Place
- 5609 Knox Ct
- 5541 Knox Place Unit 3
- 5610 Knox Ct
- 5588 Patrick Ct
- 4384 Fitzpatrick Way
- 5598 Patrick Ct
- 5619 Knox Ct Unit IV
- 5558 Patrick Ct
- 5527 Patrick Ct Unit 3
- 4344 Fitzpatrick Way
- 5531 Knox Place Unit 3
- 5531 Knox Place
- 4394 Fitzpatrick Way
- 4394 Fitzpatrick Way Unit 17