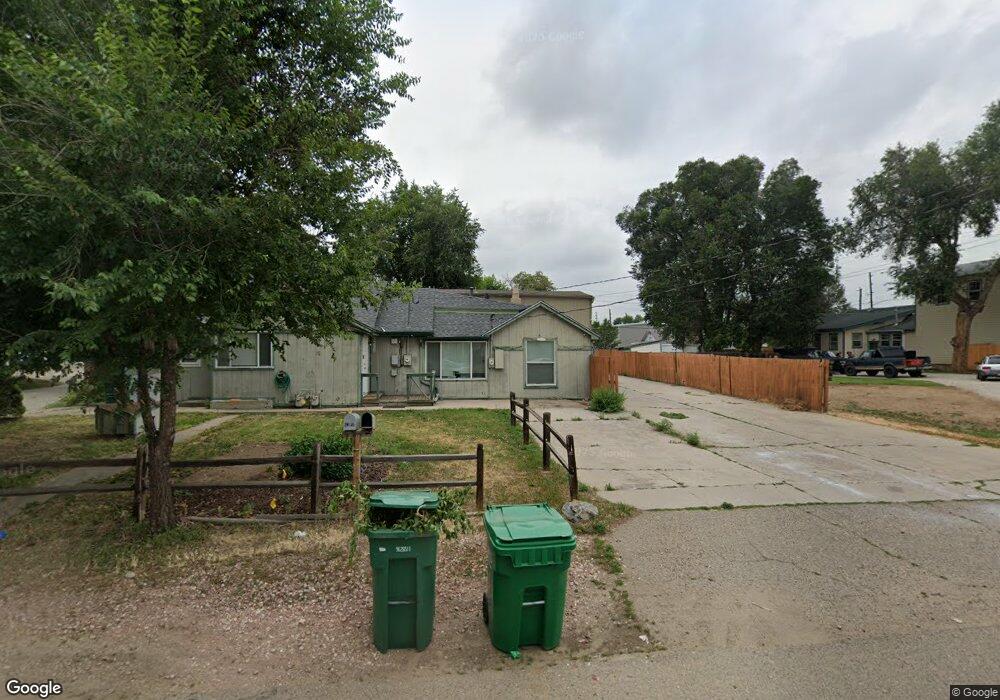
4375 Moore St Wheat Ridge, CO 80033
Fruitdale NeighborhoodEstimated Value: $548,000 - $602,000
4
Beds
2
Baths
1,819
Sq Ft
$314/Sq Ft
Est. Value
About This Home
This home is located at 4375 Moore St, Wheat Ridge, CO 80033 and is currently estimated at $571,310, approximately $314 per square foot. 4375 Moore St is a home located in Jefferson County with nearby schools including Prospect Valley Elementary School, Kullerstrand Elementary School, and Everitt Middle School.
Ownership History
Date
Name
Owned For
Owner Type
Purchase Details
Closed on
Apr 1, 1999
Sold by
Bohm Thomas D and Bohm Rebecca R
Bought by
Lee Scott A and Lee Denise L
Current Estimated Value
Home Financials for this Owner
Home Financials are based on the most recent Mortgage that was taken out on this home.
Original Mortgage
$92,465
Outstanding Balance
$23,453
Interest Rate
7.06%
Estimated Equity
$547,857
Purchase Details
Closed on
Mar 8, 1999
Sold by
Mcfarlin Christopher G and Mcfarlin Linda
Bought by
Mcfarlin Christopher G and Mcfarlin Linda R
Home Financials for this Owner
Home Financials are based on the most recent Mortgage that was taken out on this home.
Original Mortgage
$92,465
Outstanding Balance
$23,453
Interest Rate
7.06%
Estimated Equity
$547,857
Purchase Details
Closed on
Dec 21, 1993
Sold by
First Community Industrial Bank
Bought by
Mcfarlin Christopher G and Mcfarlin Linda
Home Financials for this Owner
Home Financials are based on the most recent Mortgage that was taken out on this home.
Original Mortgage
$65,755
Interest Rate
7.16%
Create a Home Valuation Report for This Property
The Home Valuation Report is an in-depth analysis detailing your home's value as well as a comparison with similar homes in the area
Home Values in the Area
Average Home Value in this Area
Purchase History
| Date | Buyer | Sale Price | Title Company |
|---|---|---|---|
| Lee Scott A | $131,325 | -- | |
| Mcfarlin Christopher G | -- | -- | |
| Mcfarlin Christopher G | $73,000 | -- |
Source: Public Records
Mortgage History
| Date | Status | Borrower | Loan Amount |
|---|---|---|---|
| Open | Lee Scott A | $92,465 | |
| Closed | Mcfarlin Christopher G | $90,000 | |
| Previous Owner | Mcfarlin Christopher G | $65,755 |
Source: Public Records
Tax History Compared to Growth
Tax History
| Year | Tax Paid | Tax Assessment Tax Assessment Total Assessment is a certain percentage of the fair market value that is determined by local assessors to be the total taxable value of land and additions on the property. | Land | Improvement |
|---|---|---|---|---|
| 2024 | $2,834 | $30,859 | $19,416 | $11,443 |
| 2023 | $2,834 | $30,859 | $19,416 | $11,443 |
| 2022 | $2,536 | $27,340 | $13,303 | $14,037 |
| 2021 | $2,576 | $28,127 | $13,686 | $14,441 |
| 2020 | $2,314 | $25,292 | $12,829 | $12,463 |
| 2019 | $2,281 | $25,292 | $12,829 | $12,463 |
| 2018 | $1,816 | $19,569 | $6,161 | $13,408 |
| 2017 | $1,655 | $19,569 | $6,161 | $13,408 |
| 2016 | $1,513 | $16,730 | $5,276 | $11,454 |
| 2015 | $1,350 | $16,730 | $5,276 | $11,454 |
| 2014 | $1,350 | $14,034 | $4,872 | $9,162 |
Source: Public Records
Map
Nearby Homes
- 10640 W 46th Ave
- 10630 W 46th Ave
- 4340 Pierson St
- 10251 W 44th Ave Unit 8-206
- 4040 Newman St
- 4615 Quail St
- 4605 Quail St
- 10095 W 41st Ave
- 3935 Pierson St
- 3801 Oak St
- 9870 W 41st Ave
- 3744 Miller Ct
- 10169 W 38th Ave
- 10187 W 38th Ave
- 3730 Miller Ct
- 3738 Miller Ct
- 10163 W 38th Ave
- 10151 W 38th Ave
- 4607 Independence St
- 11345 W 38th Ave
- 4373 Moore St
- 10600 W 44th Ave
- 4355 Moore St Unit 4355-4361
- 4355 Moore St
- 4350 Newcombe St
- 4340 Newcombe St
- 10612 W 44th Ave
- 10500 W 44th Ave
- 10590 W 44th Ave
- 4320 Newcombe St
- 4375 Newcombe St
- 4300 Newcombe St
- 4343 Newcombe St
- 10740 W 44th Ave
- 4350 Oak St
- 4330 Oak St
- 4340 Oak St Unit 4340
- 10760 W 44th Ave
- 4290 Newcombe St
- 10509 W 44th Ave