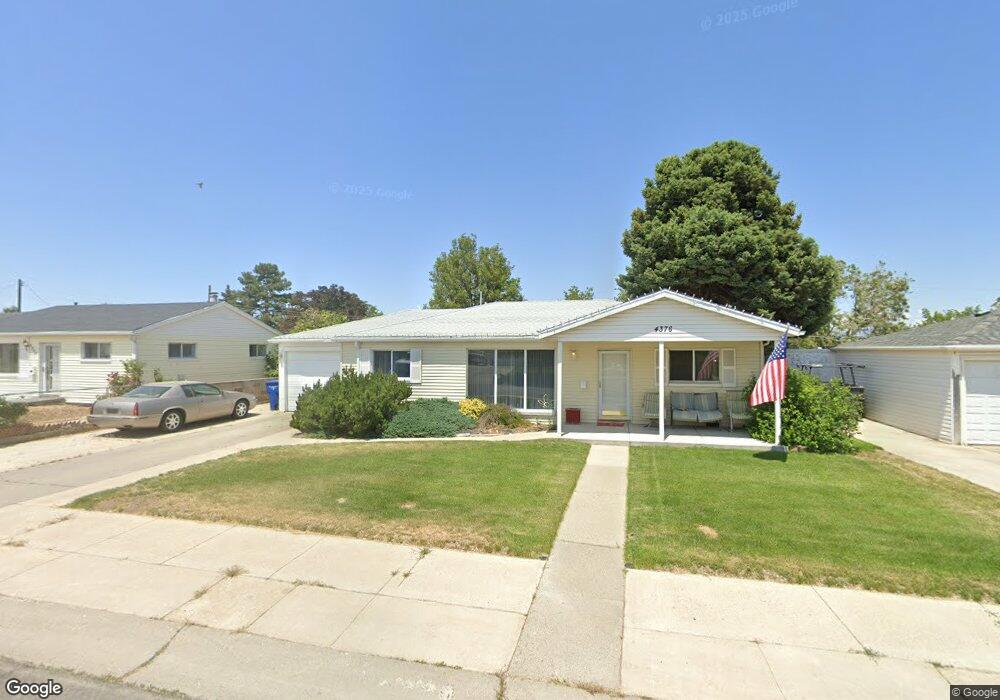
4376 W 5135 S Salt Lake City, UT 84118
Estimated Value: $399,000 - $409,000
3
Beds
2
Baths
1,590
Sq Ft
$253/Sq Ft
Est. Value
About This Home
This home is located at 4376 W 5135 S, Salt Lake City, UT 84118 and is currently estimated at $403,046, approximately $253 per square foot. 4376 W 5135 S is a home located in Salt Lake County with nearby schools including David Gourley Elementary School, Kearns Jr High School, and Kearns High School.
Ownership History
Date
Name
Owned For
Owner Type
Purchase Details
Closed on
Feb 23, 2024
Sold by
Bowers Jack and Bowers Steven
Bought by
Jack Earl Bowers Living Trust and Bowers
Current Estimated Value
Purchase Details
Closed on
Aug 8, 2023
Sold by
Bowers Jack
Bought by
Bowers Jack and Bowers Steven
Home Financials for this Owner
Home Financials are based on the most recent Mortgage that was taken out on this home.
Original Mortgage
$176,500
Interest Rate
6.67%
Mortgage Type
New Conventional
Purchase Details
Closed on
Jul 27, 2023
Sold by
Jack Lee Bowers Living Trust and Barbara Louise Bowers Living Trust
Bought by
Bowers Jack
Home Financials for this Owner
Home Financials are based on the most recent Mortgage that was taken out on this home.
Original Mortgage
$176,500
Interest Rate
6.67%
Mortgage Type
New Conventional
Purchase Details
Closed on
Nov 25, 2014
Sold by
Bowers Jack Lee and Bowers Barbara L
Bought by
Bowers Jack Lee and The Jack Lee Bowers Living Trust
Create a Home Valuation Report for This Property
The Home Valuation Report is an in-depth analysis detailing your home's value as well as a comparison with similar homes in the area
Home Values in the Area
Average Home Value in this Area
Purchase History
| Date | Buyer | Sale Price | Title Company |
|---|---|---|---|
| Jack Earl Bowers Living Trust | -- | -- | |
| Bowers Jack | -- | -- | |
| Bowers Jack | -- | None Listed On Document | |
| Bowers Jack Lee | -- | None Available |
Source: Public Records
Mortgage History
| Date | Status | Borrower | Loan Amount |
|---|---|---|---|
| Previous Owner | Bowers Jack | $176,500 |
Source: Public Records
Tax History Compared to Growth
Tax History
| Year | Tax Paid | Tax Assessment Tax Assessment Total Assessment is a certain percentage of the fair market value that is determined by local assessors to be the total taxable value of land and additions on the property. | Land | Improvement |
|---|---|---|---|---|
| 2025 | $2,572 | $363,900 | $95,700 | $268,200 |
| 2024 | $2,572 | $346,300 | $89,900 | $256,400 |
| 2023 | $2,395 | $309,700 | $86,400 | $223,300 |
| 2022 | $2,432 | $323,000 | $84,700 | $238,300 |
| 2021 | $2,231 | $268,300 | $65,200 | $203,100 |
| 2020 | $2,004 | $225,100 | $59,400 | $165,700 |
| 2019 | $1,997 | $222,000 | $56,000 | $166,000 |
| 2018 | $0 | $202,500 | $56,000 | $146,500 |
| 2017 | $1,566 | $175,800 | $56,000 | $119,800 |
| 2016 | $1,325 | $149,000 | $51,600 | $97,400 |
| 2015 | -- | $124,400 | $63,000 | $61,400 |
| 2014 | $1,109 | $113,600 | $58,500 | $55,100 |
Source: Public Records
Map
Nearby Homes