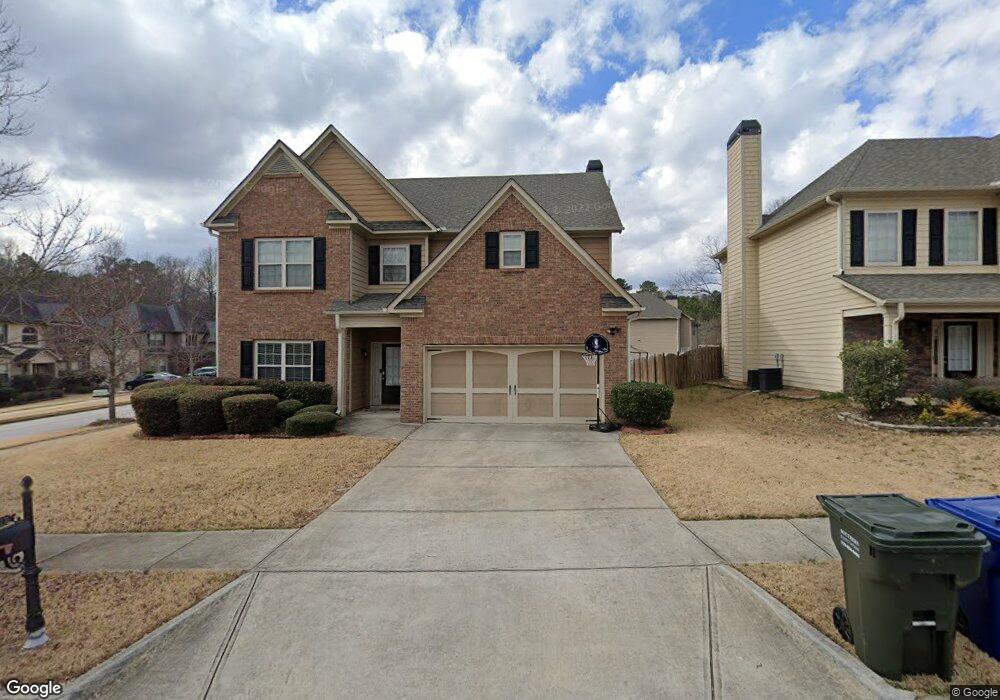
4377 Gateview Dr Unit 74 Loganville, GA 30052
Estimated Value: $377,259 - $409,000
4
Beds
3
Baths
2,734
Sq Ft
$144/Sq Ft
Est. Value
About This Home
This home is located at 4377 Gateview Dr Unit 74, Loganville, GA 30052 and is currently estimated at $394,815, approximately $144 per square foot. 4377 Gateview Dr Unit 74 is a home located in Gwinnett County with nearby schools including Rosebud Elementary School, Grace Snell Middle School, and South Gwinnett High School.
Ownership History
Date
Name
Owned For
Owner Type
Purchase Details
Closed on
Nov 3, 2016
Sold by
Tarbert Llc
Bought by
Csh 2016 2 Borrower Llc
Current Estimated Value
Purchase Details
Closed on
Feb 28, 2014
Sold by
Williams-Washin Tracie
Bought by
Tarbert Llc
Purchase Details
Closed on
Jul 14, 2009
Sold by
Wachovia Bank
Bought by
Meridian Hms Of Arbors/Rosebud
Home Financials for this Owner
Home Financials are based on the most recent Mortgage that was taken out on this home.
Original Mortgage
$170,641
Interest Rate
5.53%
Mortgage Type
FHA
Purchase Details
Closed on
Jul 10, 2009
Sold by
Williams-Washingto Tracie
Bought by
Williams-Washingto Tracie and Washington Willie
Home Financials for this Owner
Home Financials are based on the most recent Mortgage that was taken out on this home.
Original Mortgage
$170,641
Interest Rate
5.53%
Mortgage Type
FHA
Create a Home Valuation Report for This Property
The Home Valuation Report is an in-depth analysis detailing your home's value as well as a comparison with similar homes in the area
Home Values in the Area
Average Home Value in this Area
Purchase History
| Date | Buyer | Sale Price | Title Company |
|---|---|---|---|
| Csh 2016 2 Borrower Llc | -- | -- | |
| Tarbert Llc | $159,500 | -- | |
| Meridian Hms Of Arbors/Rosebud | -- | -- | |
| Williams-Washingto Tracie | -- | -- | |
| Williams-Washingto Tracie | $173,800 | -- |
Source: Public Records
Mortgage History
| Date | Status | Borrower | Loan Amount |
|---|---|---|---|
| Previous Owner | Williams-Washingto Tracie | $170,641 |
Source: Public Records
Tax History Compared to Growth
Tax History
| Year | Tax Paid | Tax Assessment Tax Assessment Total Assessment is a certain percentage of the fair market value that is determined by local assessors to be the total taxable value of land and additions on the property. | Land | Improvement |
|---|---|---|---|---|
| 2025 | $5,684 | $150,920 | $29,680 | $121,240 |
| 2024 | $5,742 | $150,920 | $29,680 | $121,240 |
| 2023 | $5,742 | $153,240 | $29,680 | $123,560 |
| 2022 | $4,783 | $124,760 | $24,000 | $100,760 |
| 2021 | $3,319 | $82,440 | $14,000 | $68,440 |
| 2020 | $3,337 | $82,440 | $14,000 | $68,440 |
| 2019 | $2,782 | $82,440 | $14,000 | $68,440 |
| 2018 | $2,919 | $74,000 | $12,000 | $62,000 |
| 2016 | $2,936 | $74,000 | $12,000 | $62,000 |
| 2015 | $2,606 | $63,800 | $12,000 | $51,800 |
| 2014 | -- | $67,720 | $12,000 | $55,720 |
Source: Public Records
Map
Nearby Homes
- 1906 Knight Cir
- 1892 Ivy View Walk
- 4451 Ivy View Ct
- 719 Sara Meadow Rd
- 4355 Brookridge Dr
- 1735 Knight Cir
- 1675 Knight Cir
- 4450 Ivy Fork Dr
- Raleigh Plan at Braswell Farms
- Wescott Plan at Braswell Farms
- Davidson Plan at Braswell Farms
- Cypress Plan at Braswell Farms
- Avery Plan at Braswell Farms
- Fenwick Plan at Braswell Farms
- 1807 Kingsmere Run Dr
- 1836 Kingsmere Run Dr Unit LOT 6
- 1826 Kingsmere Run Dr
- 1827 Kingsmere Run Dr
- 1866 Kingsmere Run Dr
- 1846 Kingsmere Run Dr
- 4377 Gateview Dr
- 4377 Gateview Dr SW
- 4367 Gateview Dr
- 1919 Trellis View Ct
- 1903 Trellis View Ct
- 4376 Gateview Dr Unit 4
- 4376 Gateview Dr
- 4357 Gateview Dr
- 4397 Gateview Dr
- 4366 Gateview Dr
- 1929 Trellis View Ct
- 1908 Trellis View Ct
- 1908 Trellis View Ct Unit LOT 65
- 4386 Gateview Dr
- 4347 Gateview Dr
- 4347 Gateview Dr Unit LOT 77
- 1918 Trellis View Ct
- 4356 Gateview Dr
- 4416 Gateview Dr
- 4407 Gateview Dr