4379 E Harbors Edge Dr Unit 133 Port Clinton, OH 43452
Estimated Value: $734,000 - $851,012
3
Beds
3
Baths
2,185
Sq Ft
$367/Sq Ft
Est. Value
About This Home
This home is located at 4379 E Harbors Edge Dr Unit 133, Port Clinton, OH 43452 and is currently estimated at $802,503, approximately $367 per square foot. 4379 E Harbors Edge Dr Unit 133 is a home located in Ottawa County with nearby schools including Bataan Memorial Primary School, Bataan Memorial Intermediate School, and Port Clinton Middle School.
Ownership History
Date
Name
Owned For
Owner Type
Purchase Details
Closed on
Apr 1, 2011
Sold by
French Maureen A and French Charles J
Bought by
Meteer Trent L
Current Estimated Value
Home Financials for this Owner
Home Financials are based on the most recent Mortgage that was taken out on this home.
Original Mortgage
$249,600
Outstanding Balance
$174,121
Interest Rate
5.04%
Mortgage Type
New Conventional
Estimated Equity
$628,382
Purchase Details
Closed on
Apr 25, 2007
Sold by
Harbors Edge Development Ltd
Bought by
French Maureen A
Home Financials for this Owner
Home Financials are based on the most recent Mortgage that was taken out on this home.
Original Mortgage
$286,500
Interest Rate
6.2%
Mortgage Type
Purchase Money Mortgage
Create a Home Valuation Report for This Property
The Home Valuation Report is an in-depth analysis detailing your home's value as well as a comparison with similar homes in the area
Home Values in the Area
Average Home Value in this Area
Purchase History
| Date | Buyer | Sale Price | Title Company |
|---|---|---|---|
| Meteer Trent L | $312,000 | Hartung Title | |
| French Maureen A | $358,200 | County Title Co |
Source: Public Records
Mortgage History
| Date | Status | Borrower | Loan Amount |
|---|---|---|---|
| Open | Meteer Trent L | $249,600 | |
| Previous Owner | French Maureen A | $286,500 |
Source: Public Records
Tax History Compared to Growth
Tax History
| Year | Tax Paid | Tax Assessment Tax Assessment Total Assessment is a certain percentage of the fair market value that is determined by local assessors to be the total taxable value of land and additions on the property. | Land | Improvement |
|---|---|---|---|---|
| 2024 | $6,635 | $204,660 | $61,030 | $143,630 |
| 2023 | $6,635 | $146,098 | $46,946 | $99,152 |
| 2022 | $5,205 | $146,098 | $46,946 | $99,152 |
| 2021 | $5,196 | $146,100 | $46,950 | $99,150 |
| 2020 | $4,381 | $118,490 | $36,110 | $82,380 |
| 2019 | $4,337 | $118,490 | $36,110 | $82,380 |
| 2018 | $4,330 | $118,490 | $36,110 | $82,380 |
| 2017 | $4,022 | $108,460 | $32,830 | $75,630 |
| 2016 | $4,031 | $108,460 | $32,830 | $75,630 |
| 2015 | $4,047 | $108,460 | $32,830 | $75,630 |
| 2014 | $1,978 | $108,460 | $32,830 | $75,630 |
| 2013 | $3,968 | $108,460 | $32,830 | $75,630 |
Source: Public Records
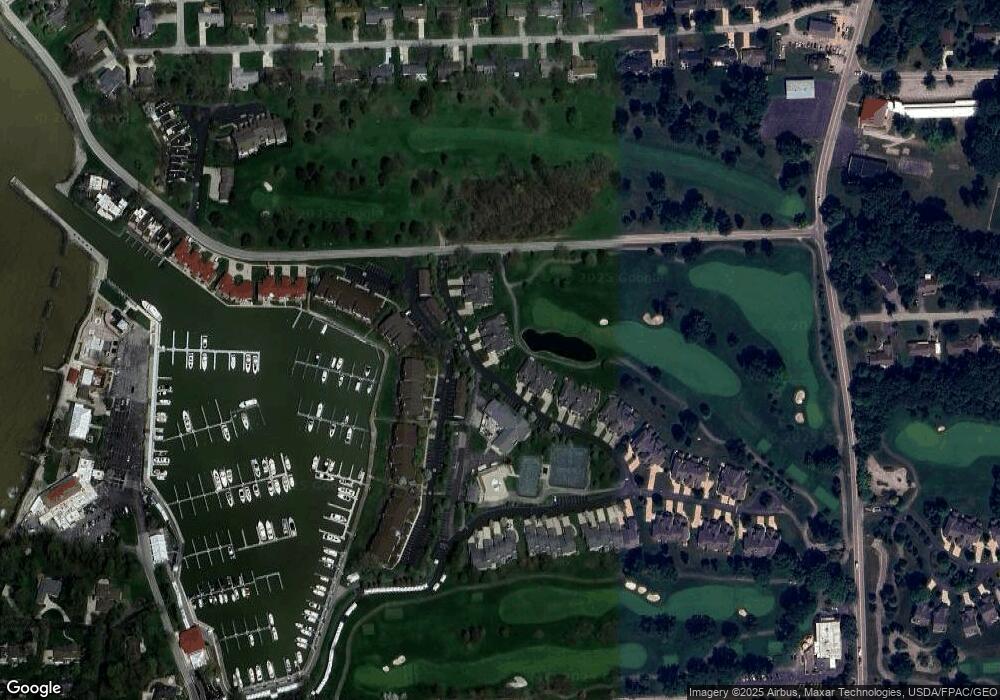
Map
Nearby Homes
- 4434 E Harbors Edge Dr Unit 25
- 4520 E Harbors Edge Dr Unit 61
- 3305 N Stonehouse Dr Unit 7
- 4866 Westwinds Dr
- 2950 N Bluff Ridge Dr
- 3737 N Karwood Dr
- 4862 Tradewinds Dr
- 2855 N Canterbury Cir Unit A
- 2901 Villa Ct Unit C
- 2750 Canterbury Cir Unit C
- 2769 Canterbury Cir
- 2769 N Canterbury Cir Unit B
- 3778 N Cliff Rd
- 3983 Coachmans Trail
- 2369 N Peachtree Ln Unit Sublot 10
- 2397 N Peachtree Ln Unit Sublot 9
- 2621 N Peachtree Ln Unit Sublot 1
- 2537 N Peachtree Ln Unit Sublot 4
- 2593 N Peachtree Ln Unit Sublot 2
- 2509 N Peachtree Ln Unit Sublot 5
- 4373 E Harbors Edge Dr Unit 132
- 4367 E Harbors Edge Dr Unit 131
- 4389 E Harbors Edge Dr Unit 121
- 4395 E Harbors Edge Dr Unit 122
- 4357 E Harbors Edge Dr Unit 143
- 4401 E Harbors Edge Dr Unit 123
- 4351 E Harbors Edge Dr Unit 142
- 3192 N Marina View Dr Unit 6
- 3190 N Marina View Dr
- 4345 E Harbors Edge Dr Unit 141
- 3172 N Marina View Dr
- 3166 N Marina View Dr Unit 5
- 3186 N Marina View Dr
- 3184 N Marina View Dr
- 4411 E Harbors Edge Dr Unit 111
- 3204 N Marina View Dr
- 3178 N Marina View Dr
- 3202 N Marina View Dr
- 3174 N Marina View Dr Unit 9
- 3168 N Marina View Dr Unit G19